HSBC 2001 Annual Report Download - page 60
Download and view the complete annual report
Please find page 60 of the 2001 HSBC annual report below. You can navigate through the pages in the report by either clicking on the pages listed below, or by using the keyword search tool below to find specific information within the annual report.-
 1
1 -
2
-
3
-
4
-
5
-
6
-
7
-
8
-
9
-
10
-
11
-
12
-
13
-
14
-
15
-
16
-
17
-
18
-
19
-
20
-
21
-
22
-
23
-
24
-
25
-
26
-
27
-
28
-
29
-
30
-
31
-
32
-
33
-
34
-
35
-
36
-
37
-
38
-
39
-
40
-
41
-
42
-
43
-
44
-
45
-
46
-
47
-
48
-
49
-
 50
50 -
 51
51 -
 52
52 -
 53
53 -
 54
54 -
 55
55 -
 56
56 -
 57
57 -
 58
58 -
 59
59 -
 60
60 -
 61
61 -
 62
62 -
 63
63 -
 64
64 -
 65
65 -
 66
66 -
 67
67 -
 68
68 -
 69
69 -
 70
70 -
71
-
72
-
73
-
74
-
75
-
76
-
77
-
78
-
79
-
80
-
81
-
82
-
83
-
84
-
85
-
86
-
87
-
88
-
89
-
90
-
91
-
92
-
93
-
94
-
95
-
96
-
97
-
98
-
99
-
100
-
101
-
102
-
103
-
104
-
105
-
106
-
107
-
108
-
109
-
110
-
111
-
112
-
113
-
114
-
115
-
116
-
117
-
118
-
119
-
120
-
121
-
122
-
123
-
124
-
125
-
126
-
127
-
128
-
129
-
130
-
131
-
132
-
133
-
134
-
135
-
136
-
137
-
138
-
139
-
140
-
141
-
142
-
143
-
144
-
145
-
146
-
147
-
148
-
149
-
150
-
151
-
152
-
153
-
154
-
155
-
156
-
157
-
158
-
159
-
160
-
161
-
162
-
163
-
164
-
165
-
166
-
167
-
168
-
169
-
170
-
171
-
172
-
173
-
174
-
175
-
176
-
177
-
178
-
179
-
180
-
181
-
182
-
183
-
184
-
185
-
186
-
187
-
188
-
189
-
190
-
191
-
192
-
193
-
194
-
195
-
196
-
197
-
198
-
199
-
200
-
201
-
202
-
203
-
204
-
205
-
206
-
207
-
208
-
209
-
210
-
211
-
212
-
213
-
214
-
215
-
216
-
217
-
218
-
219
-
220
-
221
-
222
-
223
-
224
-
225
-
226
-
227
-
228
-
229
-
230
-
231
-
232
-
233
-
234
-
235
-
236
-
237
-
238
-
239
-
240
-
241
-
242
-
243
-
244
-
245
-
246
-
247
-
248
-
249
-
250
-
251
-
252
-
253
-
254
-
255
-
256
-
257
-
258
-
259
-
260
-
261
-
262
-
263
-
264
-
265
-
266
-
267
-
268
-
269
-
270
-
271
-
272
-
273
-
274
-
275
-
276
-
277
-
278
-
279
-
280
-
281
-
282
-
283
-
284
 |
 |

HSBC HOLDINGS PLC
Financial Review (continued)
58
Korean bonds which had been provided for in the
investment bank in 1999 and higher foreign
exchange profits as a result of increased corporate
business volumes, partly offset by mark-to-market
losses on bonds in the Investment Bank and the bank
in Hong Kong.
Operating expenses increased by US$91 million,
or 5 per cent, and included US$87 million in costs,
mainly attributable to staff costs and advertising and
promotion expenses relating to the launch of the
Mandatory Provident Fund in Hong Kong. This
represented an increase of US$65 million compared
with 1999.
Staff costs were held broadly at the same level
as last year. Increases in staff costs in the investment
bank, due to higher profit-related remuneration, and
in HBSC Insurance, due to the launch of the
Mandatory Provident Fund, were offset by a
reduction in Hang Seng Bank as a result of lower
headcount and reductions in pension costs in the
bank. Operating expenses, other than staff costs,
increased by US$70 million, or 9 per cent, mainly in
advertising and marketing expenses and development
costs relating to HSBC's e-banking initiatives.
Premises and equipment expenses were reduced
compared with 1999, reflecting lower rental
expenses.
Provisions for bad and doubtful debts decreased
significantly by US$337 million, or 58 per cent. The
charge for new specific provisions decreased by
US$266 million to US$454 million whilst releases
and recoveries increased by US$106 million to
US$207 million, the latter mainly in respect of
corporate customers. The net bad debt charge for the
year fell from 90 basis points of advances in 1999 to
37 basis points in 2000.
There was a small net release of provisions for
bad and doubtful debts in respect of lending to
mainland China related companies booked in Hong
Kong in 2000 compared with a charge of US$142
million in 1999. The net charge for specific
provisions for personal lending in Hong Kong
decreased reflecting the improved economic
conditions: increased provisions for residential
mortgages were more than offset by decreased
provisions for other personal lending. Delinquency
rates for residential mortgages in 2000 remained low.
Non-performing advances as a percentage of
total advances decreased from 4.8 per cent at 31
December 1999 to 3.8 per cent at 31 December 2000
as a result of a reduction in non-performing
advances, due to a combination of write-offs,
upgrades and recoveries, and an increase in total
advances to customers.
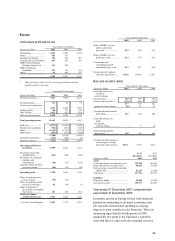
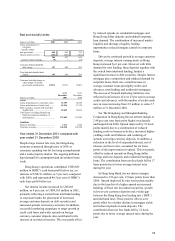
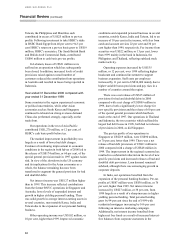
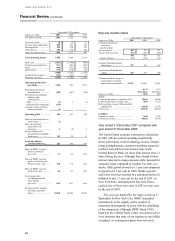
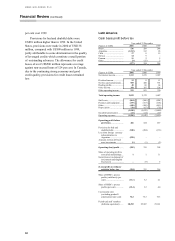
Rest of Asia-Pacific (including the Middle
East)
Year ended 31 December
Figures in US$m 2001 2000 1999
Net interest income............... 1,482 1,367 1,240
Dividend income .................. 332
Net fees and commissions..... 681 710 645
Dealing profits...................... 395 324 300
Other income ........................ 58 48 36
Other operating income ........ 1,137 1,085 983
Total operating income 2,619 2,452 2,223
Staff costs............................. (771 ) (733) (642)
Premises and equipment (143) (137) (127 )
Othe
r
.................................... (401) (343) (309 )
Depreciatio
n
......................... (82 ) (79 ) (70)
(1,397) (1,292 ) (1,148)
Goodwill amortisatio
n
.......... (8) (5 ) (14 )
Operating expenses............... (1,405) (1,297 ) (1,162)
Operating profit before
provisions........................ 1,214 1,155 1,061
Provisions for bad and
doubtful debts .................. (172 ) 15 (809)
Provisions for
contingent liabilities and
commitments ................... (43 ) 5 (30)
Amounts written off fixed
asset investments ............. (11 ) (3 ) (1)
Operating profit.................. 988 1,172 221
Share of operating loss in
joint venture..................... (5)
–
–
Share of operating profit in
associates ......................... 99 100 94
Gains/(losses) on disposal o
f
investments and tangible
fixed assets ...................... 6(7 ) 14
Profit on ordinary
activities before ta
x
........ 1,088 1,265 329
Share of HSBC’ s pre-tax
profits (cash basis) (per
cent)................................. 12.4 12.3 4.3
Share of HSBC’ s pre-tax
p
rofits (per cent) .............. 13.6 12.9 4.1
Cost:income ratio
(excluding goodwill
amortisation) (per cent).... 53.3 52.7 51.6
Period-end staff numbers
(full-time equivalent) ....... 26,259 22,919 21,375