HSBC 2001 Annual Report Download - page 39
Download and view the complete annual report
Please find page 39 of the 2001 HSBC annual report below. You can navigate through the pages in the report by either clicking on the pages listed below, or by using the keyword search tool below to find specific information within the annual report.-
 1
1 -
2
-
3
-
4
-
5
-
6
-
7
-
8
-
9
-
10
-
11
-
12
-
13
-
14
-
15
-
16
-
17
-
18
-
19
-
20
-
21
-
22
-
23
-
24
-
25
-
26
-
27
-
28
-
 29
29 -
 30
30 -
 31
31 -
 32
32 -
 33
33 -
 34
34 -
 35
35 -
 36
36 -
 37
37 -
 38
38 -
 39
39 -
 40
40 -
 41
41 -
 42
42 -
 43
43 -
 44
44 -
 45
45 -
 46
46 -
 47
47 -
 48
48 -
 49
49 -
50
-
51
-
52
-
53
-
54
-
55
-
56
-
57
-
58
-
59
-
60
-
61
-
62
-
63
-
64
-
65
-
66
-
67
-
68
-
69
-
70
-
71
-
72
-
73
-
74
-
75
-
76
-
77
-
78
-
79
-
80
-
81
-
82
-
83
-
84
-
85
-
86
-
87
-
88
-
89
-
90
-
91
-
92
-
93
-
94
-
95
-
96
-
97
-
98
-
99
-
100
-
101
-
102
-
103
-
104
-
105
-
106
-
107
-
108
-
109
-
110
-
111
-
112
-
113
-
114
-
115
-
116
-
117
-
118
-
119
-
120
-
121
-
122
-
123
-
124
-
125
-
126
-
127
-
128
-
129
-
130
-
131
-
132
-
133
-
134
-
135
-
136
-
137
-
138
-
139
-
140
-
141
-
142
-
143
-
144
-
145
-
146
-
147
-
148
-
149
-
150
-
151
-
152
-
153
-
154
-
155
-
156
-
157
-
158
-
159
-
160
-
161
-
162
-
163
-
164
-
165
-
166
-
167
-
168
-
169
-
170
-
171
-
172
-
173
-
174
-
175
-
176
-
177
-
178
-
179
-
180
-
181
-
182
-
183
-
184
-
185
-
186
-
187
-
188
-
189
-
190
-
191
-
192
-
193
-
194
-
195
-
196
-
197
-
198
-
199
-
200
-
201
-
202
-
203
-
204
-
205
-
206
-
207
-
208
-
209
-
210
-
211
-
212
-
213
-
214
-
215
-
216
-
217
-
218
-
219
-
220
-
221
-
222
-
223
-
224
-
225
-
226
-
227
-
228
-
229
-
230
-
231
-
232
-
233
-
234
-
235
-
236
-
237
-
238
-
239
-
240
-
241
-
242
-
243
-
244
-
245
-
246
-
247
-
248
-
249
-
250
-
251
-
252
-
253
-
254
-
255
-
256
-
257
-
258
-
259
-
260
-
261
-
262
-
263
-
264
-
265
-
266
-
267
-
268
-
269
-
270
-
271
-
272
-
273
-
274
-
275
-
276
-
277
-
278
-
279
-
280
-
281
-
282
-
283
-
284
 |
 |
37
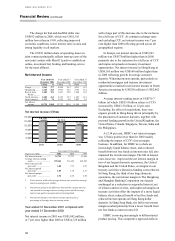
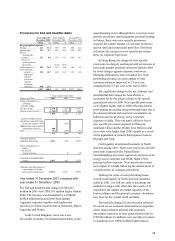
HSBC made a profit on ordinary activities
before tax of US$8,000 million in 2001, a decrease
of US$1,775 million, or 18 per cent, compared with
2000. On a cash basis, profit before tax decreased by
US$1,493 million, or 14 per cent, compared with
2000. At constant exchange rates, cash basis profit
before tax was 12 per cent lower than 2000.
Net interest income of US$14,725 million in
2001 was US$1,002 million, or 7 per cent, higher
than 2000, with a large part of this increase due to
the inclusion of CCF for a full year. Net interest
income in North America was US$250 million, or 12
per cent, higher than 2000 mainly reflecting growth
in average interest-earning assets and the benefit of
lower funding costs.
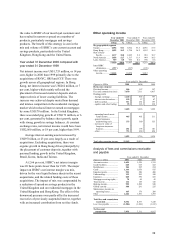
Other operating income rose by US$313 million,
or 3 per cent, to US$11,163 million compared with
2000. This increase was primarily driven by the
acquisition of CCF and by growth in wealth
management income which offset falls in securities-
related fee and commission income.
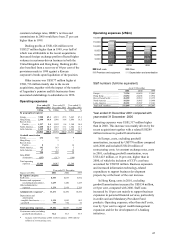
Operating expenses, excluding goodwill
amortisation, were US$1,028 million, or 8 per cent,
higher than 2000. This increase principally reflected
recent acquisitions.
HSBC’s cost: income ratio, excluding goodwill
amortisation, increased to 56.4 per cent compared
with 55.3 per cent in 2000, reflecting the cost
structures of new acquisitions and investment in the
expanding wealth management business and IT.
The charge for bad and doubtful debts was
US$2,037 million in 2001, which was US$1,105
million higher than in 2000. This mainly reflected
the US$600 million general provision against
Argentine exposure and specific provisions made
against a small number of corporate borrowers.
Other provisions included a loss of US$520 million
arising from the foreign currency redenomination in
Argentina and a charge of US$575 million for the
Princeton Note Matter.
The US$91 million share of operating losses in
joint ventures principally reflected continuing start-
up costs of Merrill Lynch HSBC, now operational in
the UK, Canada and Australia.
The charge for amounts written-off fixed asset
investments arose mainly from venture capital
investments and holdings of emerging technology
stocks.
Gains on disposal of investments of US$754
million included profit on the sale of HSBC’s 20 per
cent stake in British Interactive Broadcasting and the
investment in Modern Terminals Limited. In
addition, disposal gains of US$170 million were
realised from sales of investment debt securities to
adjust to changes in interest rate conditions.
Year ended 31 December 2000 compared with
year ended 31 December 1999
HSBC made a profit on ordinary activities before tax
of US$9,775 million in 2000, an increase of
US$1,793 million, or 22 per cent, compared with
1999. On a cash basis, profit before tax increased by
US$2,282 million, or 28 per cent, compared with
1999.
Net interest income of US$13,723 million in
2000 was US$1,733 million higher than 1999, with a
large part of this increase due to the acquisitions of
RNYC, SRH and CCF. Net interest income in Hong
Kong in 2000 was US$262 million, or 7 per cent,
higher than 1999 mainly reflecting the placement of
increased customer deposits.
Other operating income rose by US$1,838
million, or 20 per cent, to US$10,850 million
compared with 1999. This increase was driven by the
acquisitions of RNYC, SRH and CCF, together with
underlying growth in fee income, particularly in
Hong Kong and, at constant exchange rates, in the
UK bank.
Operating expenses, excluding goodwill
amortisation, were US$2,264 million, or 20 per cent,
higher than 1999. Excluding the impact of the recent
acquisitions, there were increases in Hong Kong,
mainly related to the launch of the Mandatory
Provident Fund and e-banking initiatives, and in the
rest of Asia-Pacific and Latin America, to support
business growth. In addition, at constant exchange
rates, there were underlying increases in Europe,
mainly reflecting growth in the wealth management
business, IT and IT-related costs directed at
improved customer service. In addition, profit-
related pay increased in investment banking in line
with the improved performance.
HSBC’s cost:income ratio, excluding goodwill
amortisation, increased to 55.3 per cent compared
with 53.9 per cent in 1999, reflecting the cost
structures of new acquisitions and of the expanding
wealth management business.