HSBC 2001 Annual Report Download - page 266
Download and view the complete annual report
Please find page 266 of the 2001 HSBC annual report below. You can navigate through the pages in the report by either clicking on the pages listed below, or by using the keyword search tool below to find specific information within the annual report.-
 1
1 -
2
-
3
-
4
-
5
-
6
-
7
-
8
-
9
-
10
-
11
-
12
-
13
-
14
-
15
-
16
-
17
-
18
-
19
-
20
-
21
-
22
-
23
-
24
-
25
-
26
-
27
-
28
-
29
-
30
-
31
-
32
-
33
-
34
-
35
-
36
-
37
-
38
-
39
-
40
-
41
-
42
-
43
-
44
-
45
-
46
-
47
-
48
-
49
-
50
-
51
-
52
-
53
-
54
-
55
-
56
-
57
-
58
-
59
-
60
-
61
-
62
-
63
-
64
-
65
-
66
-
67
-
68
-
69
-
70
-
71
-
72
-
73
-
74
-
75
-
76
-
77
-
78
-
79
-
80
-
81
-
82
-
83
-
84
-
85
-
86
-
87
-
88
-
89
-
90
-
91
-
92
-
93
-
94
-
95
-
96
-
97
-
98
-
99
-
100
-
101
-
102
-
103
-
104
-
105
-
106
-
107
-
108
-
109
-
110
-
111
-
112
-
113
-
114
-
115
-
116
-
117
-
118
-
119
-
120
-
121
-
122
-
123
-
124
-
125
-
126
-
127
-
128
-
129
-
130
-
131
-
132
-
133
-
134
-
135
-
136
-
137
-
138
-
139
-
140
-
141
-
142
-
143
-
144
-
145
-
146
-
147
-
148
-
149
-
150
-
151
-
152
-
153
-
154
-
155
-
156
-
157
-
158
-
159
-
160
-
161
-
162
-
163
-
164
-
165
-
166
-
167
-
168
-
169
-
170
-
171
-
172
-
173
-
174
-
175
-
176
-
177
-
178
-
179
-
180
-
181
-
182
-
183
-
184
-
185
-
186
-
187
-
188
-
189
-
190
-
191
-
192
-
193
-
194
-
195
-
196
-
197
-
198
-
199
-
200
-
201
-
202
-
203
-
204
-
205
-
206
-
207
-
208
-
209
-
210
-
211
-
212
-
213
-
214
-
215
-
216
-
217
-
218
-
219
-
220
-
221
-
222
-
223
-
224
-
225
-
226
-
227
-
228
-
229
-
230
-
231
-
232
-
233
-
234
-
235
-
236
-
237
-
238
-
239
-
240
-
241
-
242
-
243
-
244
-
245
-
246
-
247
-
248
-
249
-
250
-
251
-
252
-
253
-
254
-
255
-
 256
256 -
 257
257 -
 258
258 -
 259
259 -
 260
260 -
 261
261 -
 262
262 -
 263
263 -
 264
264 -
 265
265 -
 266
266 -
 267
267 -
 268
268 -
 269
269 -
 270
270 -
 271
271 -
 272
272 -
 273
273 -
 274
274 -
 275
275 -
 276
276 -
277
-
278
-
279
-
280
-
281
-
282
-
283
-
284
 |
 |

HSBC HOLDINGS PLC
Notes on the Financial Statements (continued)
264
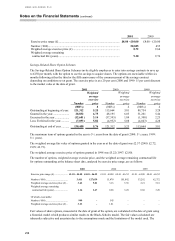
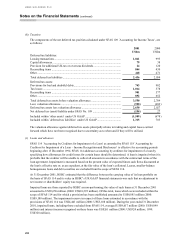
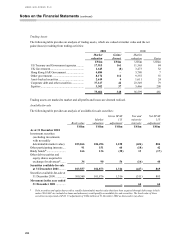
Trading Assets
The following table provides an analysis of trading assets, which are valued at market value and the net
gains/(losses) resulting from trading activities:
2001 2000
Marke
t
valuation Gains
/
(losses)
M
arke
t
valuation Gains
US$m US$m US$m US$m
US Treasury and Government agencies.......... 17,915 161 11,565 84
UK Government.............................................. 1,645 (8) 3,473 32
Hong Kong SAR Government ........................ 4,884
–
3,780 7
Other government ........................................... 8,172 112 9,355 55
Asset-backed securities................................... 2,619 4 1,611 24
Corporate debt and other securities................. 37,147 42 23,349 79
Equities ........................................................... 3,302 37 3,466 200
75,684 348 56,599 481
Trading assets are marked to market and all profits and losses are deemed realised.
Available-for-sale
The following table provides an analysis of available-for-sale securities:
Book value Market
valuation
Gross SFA
S
115
adjustmen
t
Tax an
d
minority
interests
N
et SFA
S
115
adjustment
US$m US$m US$m US$m US$m
As at 31 December 2001
Investment securities
(excluding investments
with no readily
determinable market value) 103,266 104,496 1,230 (426) 804
Other participating interests.... 91 151 60 (18) 42
Brady bonds*.......................... 166 136 (30) 13 (17)
Other debt securities and
equity shares acquired in
exchange for advances*....... 34 90 56 (16) 40
Securities available-for-sale
at 31 December 2001 ......... 103,557 104,873 1,316 (447) 869
Securities available-for-sale at
31 December 2000 .............. 100,560 101,876 1,316 (511) 805
Movement in the year ended
31 December 2001 .............
–
64 64
*Debt securities and equity shares with a readily determinable market value that have been acquired through debt swaps (which
under UK GAAP are included as loans and advances) would qualify as available-for-sale securities. The book value of these
securities incorporated a SFAS 15 adjustment of US$4 million at 31 December 2000 as discussed in (a) above.