HSBC 2001 Annual Report Download - page 192
Download and view the complete annual report
Please find page 192 of the 2001 HSBC annual report below. You can navigate through the pages in the report by either clicking on the pages listed below, or by using the keyword search tool below to find specific information within the annual report.-
 1
1 -
2
-
3
-
4
-
5
-
6
-
7
-
8
-
9
-
10
-
11
-
12
-
13
-
14
-
15
-
16
-
17
-
18
-
19
-
20
-
21
-
22
-
23
-
24
-
25
-
26
-
27
-
28
-
29
-
30
-
31
-
32
-
33
-
34
-
35
-
36
-
37
-
38
-
39
-
40
-
41
-
42
-
43
-
44
-
45
-
46
-
47
-
48
-
49
-
50
-
51
-
52
-
53
-
54
-
55
-
56
-
57
-
58
-
59
-
60
-
61
-
62
-
63
-
64
-
65
-
66
-
67
-
68
-
69
-
70
-
71
-
72
-
73
-
74
-
75
-
76
-
77
-
78
-
79
-
80
-
81
-
82
-
83
-
84
-
85
-
86
-
87
-
88
-
89
-
90
-
91
-
92
-
93
-
94
-
95
-
96
-
97
-
98
-
99
-
100
-
101
-
102
-
103
-
104
-
105
-
106
-
107
-
108
-
109
-
110
-
111
-
112
-
113
-
114
-
115
-
116
-
117
-
118
-
119
-
120
-
121
-
122
-
123
-
124
-
125
-
126
-
127
-
128
-
129
-
130
-
131
-
132
-
133
-
134
-
135
-
136
-
137
-
138
-
139
-
140
-
141
-
142
-
143
-
144
-
145
-
146
-
147
-
148
-
149
-
150
-
151
-
152
-
153
-
154
-
155
-
156
-
157
-
158
-
159
-
160
-
161
-
162
-
163
-
164
-
165
-
166
-
167
-
168
-
169
-
170
-
171
-
172
-
173
-
174
-
175
-
176
-
177
-
178
-
179
-
180
-
181
-
 182
182 -
 183
183 -
 184
184 -
 185
185 -
 186
186 -
 187
187 -
 188
188 -
 189
189 -
 190
190 -
 191
191 -
 192
192 -
 193
193 -
 194
194 -
 195
195 -
 196
196 -
 197
197 -
 198
198 -
 199
199 -
 200
200 -
 201
201 -
 202
202 -
203
-
204
-
205
-
206
-
207
-
208
-
209
-
210
-
211
-
212
-
213
-
214
-
215
-
216
-
217
-
218
-
219
-
220
-
221
-
222
-
223
-
224
-
225
-
226
-
227
-
228
-
229
-
230
-
231
-
232
-
233
-
234
-
235
-
236
-
237
-
238
-
239
-
240
-
241
-
242
-
243
-
244
-
245
-
246
-
247
-
248
-
249
-
250
-
251
-
252
-
253
-
254
-
255
-
256
-
257
-
258
-
259
-
260
-
261
-
262
-
263
-
264
-
265
-
266
-
267
-
268
-
269
-
270
-
271
-
272
-
273
-
274
-
275
-
276
-
277
-
278
-
279
-
280
-
281
-
282
-
283
-
284
 |
 |

HSBC HOLDINGS PLC
Notes on the Financial Statements (continued)
190
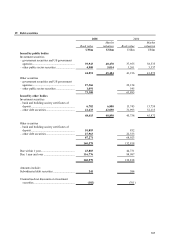
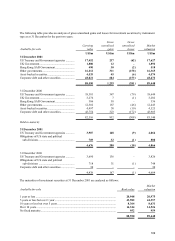
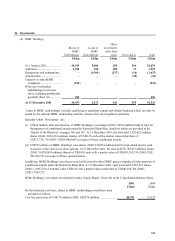
Held-to-maturity Book value
M
arke
t
valuation
1 year or less .............................................................................................................. 22 22
5 years or less but over 1 year.................................................................................... 182 191
10 years or less but over 5 years ................................................................................ 463 484
Over 10 years ............................................................................................................. 4,009 4,169
4,676 4,866
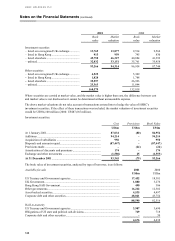
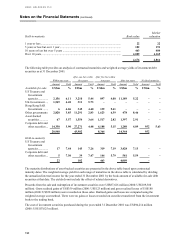
The following table provides an analysis of contractual maturities and weighted average yields of investment debt
securities as at 31 December 2001:
Within one year
After one but within
five years
After five but within
ten years After ten years No fixed maturity
Amount Yiel
d
Amoun
t
Yiel
d
Amount Yiel
d
Amount Yiel
d
Amount Yiel
d
Available-for-sale US$m % US$m % US$m % US$m % US$m %
US Treasury and
Government
agencies.............. 2,156 6.11 3,210 5.44 897 4.00 11,189 5.22 – –
UK Government .... 1,5696.483115.73––––––
Hong Kong SAR
Government ....... 6 6.06 345 4.40 139 9.41 – – – –
Other governments 2,820 3.85 11,291 2.83 1,623 6.39 478 8.46 – –
Asset-backed
securities ............ 67 3.57 1,554 3.64 1,517 2.82 1,397 2.91 – –
Corporate debt and
other securities ... 14,330 3.90 27,271 4.48 4,188 5.15 1,280 4.89 952 5.63
20,948 43,982 8,364 14,344 952
Held-to-maturity
US Treasury and
Government
agencies.............. 17 7.44 143 7.26 319 7.19 3,428 7.13 – –
Corporate debt and
other securities ... 5 7.30 39 7.47 144 5.79 581 5.59 – –
22 182 463 4,009 –
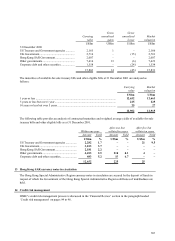
The maturity distributions of asset-backed securities are presented in the above table based upon contractual
maturity dates. The weighted average yield for each range of maturities in the above table is calculated by dividing
the annualised interest income for the year ended 31 December 2001 by the book amount of available-for-sale debt
securities at that date. The yields do not include the effect of related derivatives.
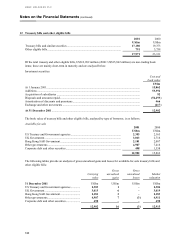
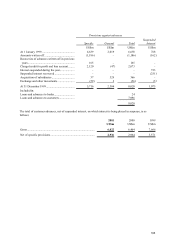
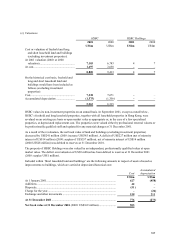
Proceeds from the sale and redemption of investment securities were US$87,626 million (2000: US$109,300
million). Gross realised gains of US$359 million (2000: US$123 million) and gross realised losses of US$180
million (2000: US$58 million) were recorded on those sales. Realised gains and losses are computed using the
weighted average cost method. There were no gains or losses recorded on securities transferred from the investment
book to the trading book.
The cost of investment securities purchased during the year ended 31 December 2001 was US$94,214 million
(2000: US$107,025 million).