HSBC 2001 Annual Report Download - page 65
Download and view the complete annual report
Please find page 65 of the 2001 HSBC annual report below. You can navigate through the pages in the report by either clicking on the pages listed below, or by using the keyword search tool below to find specific information within the annual report.-
 1
1 -
2
-
3
-
4
-
5
-
6
-
7
-
8
-
9
-
10
-
11
-
12
-
13
-
14
-
15
-
16
-
17
-
18
-
19
-
20
-
21
-
22
-
23
-
24
-
25
-
26
-
27
-
28
-
29
-
30
-
31
-
32
-
33
-
34
-
35
-
36
-
37
-
38
-
39
-
40
-
41
-
42
-
43
-
44
-
45
-
46
-
47
-
48
-
49
-
50
-
51
-
52
-
53
-
54
-
 55
55 -
 56
56 -
 57
57 -
 58
58 -
 59
59 -
 60
60 -
 61
61 -
 62
62 -
 63
63 -
 64
64 -
 65
65 -
 66
66 -
 67
67 -
 68
68 -
 69
69 -
 70
70 -
 71
71 -
 72
72 -
 73
73 -
 74
74 -
 75
75 -
76
-
77
-
78
-
79
-
80
-
81
-
82
-
83
-
84
-
85
-
86
-
87
-
88
-
89
-
90
-
91
-
92
-
93
-
94
-
95
-
96
-
97
-
98
-
99
-
100
-
101
-
102
-
103
-
104
-
105
-
106
-
107
-
108
-
109
-
110
-
111
-
112
-
113
-
114
-
115
-
116
-
117
-
118
-
119
-
120
-
121
-
122
-
123
-
124
-
125
-
126
-
127
-
128
-
129
-
130
-
131
-
132
-
133
-
134
-
135
-
136
-
137
-
138
-
139
-
140
-
141
-
142
-
143
-
144
-
145
-
146
-
147
-
148
-
149
-
150
-
151
-
152
-
153
-
154
-
155
-
156
-
157
-
158
-
159
-
160
-
161
-
162
-
163
-
164
-
165
-
166
-
167
-
168
-
169
-
170
-
171
-
172
-
173
-
174
-
175
-
176
-
177
-
178
-
179
-
180
-
181
-
182
-
183
-
184
-
185
-
186
-
187
-
188
-
189
-
190
-
191
-
192
-
193
-
194
-
195
-
196
-
197
-
198
-
199
-
200
-
201
-
202
-
203
-
204
-
205
-
206
-
207
-
208
-
209
-
210
-
211
-
212
-
213
-
214
-
215
-
216
-
217
-
218
-
219
-
220
-
221
-
222
-
223
-
224
-
225
-
226
-
227
-
228
-
229
-
230
-
231
-
232
-
233
-
234
-
235
-
236
-
237
-
238
-
239
-
240
-
241
-
242
-
243
-
244
-
245
-
246
-
247
-
248
-
249
-
250
-
251
-
252
-
253
-
254
-
255
-
256
-
257
-
258
-
259
-
260
-
261
-
262
-
263
-
264
-
265
-
266
-
267
-
268
-
269
-
270
-
271
-
272
-
273
-
274
-
275
-
276
-
277
-
278
-
279
-
280
-
281
-
282
-
283
-
284
 |
 |

63
securities custody and clearing business. Dealing
profits improved by US$12 million, or 44 per cent,
with higher profits on interest rate derivatives trading
and foreign exchange. Operating expenses rose by
US$17 million, or 24 per cent, as a result of
continued investment required to support the growth
in business.
In mainland China, the pre-tax loss of US$26
million was US$101 million lower than last year.
Provisions for bad and doubtful debts and the costs
of opening new branches continued to be the main
factors affecting results during the year. The net
charge for bad and doubtful debts in 2000 against
mainland China related companies booked in
branches in Hong Kong, China and Macau was only
1 per cent of the charge made in 1999.
In Malaysia, HSBC Bank Malaysia reported
profits before tax of US$116 million compared to a
pre-tax loss of US$125 million in 1999. The charge
for bad and doubtful debts and contingent liability
provisions was US$243 million, or 91 per cent,
lower than in 1999.
Net interest income was slightly lower as intense
competition for the limited quality lending
opportunities restricted growth in average interest-
earning assets and reduced lending margins. The net
interest margin was slightly worse than in 1999 as a
5 basis point fall in interest spread was almost
completely offset by an increased contribution from
higher levels of net free funds. The narrowing in the
interest spread was caused by a combination of
pressure on lending margins and a change in asset
mix as surplus funds were placed at lower yields
with the Central Bank and invested through the
money market.
Other operating income was 5 per cent higher
than in 1999. An improving economic environment,
together with a focus on expanding our personal
banking operations, resulted in a 29 per cent increase
in card fee income. In addition, higher dealing profits
from the sale of debt securities as bond prices rose
also contributed to the increase.
Operating expenses were in line with those in
1999.
The Middle Eastern operations of HSBC Bank
Middle East reported an increase in pre-tax profits of
US$19 million, 12 per cent higher than in 1999.
Growth in personal lending, credit card advances and
commercial overdrafts contributed to an overall
increase in net interest income of 6 per cent during
the year. However, strong growth in customer
deposits, combined with a marginal increase in
personal lending opportunities, contributed to an
overall fall in interest margin to 3.95 per cent as
surplus funds were deployed in the interbank market
and funding costs increased.
Growth in personal banking and trade related fee
income contributed to an 8 per cent growth in net
fees. Dealing profits were slightly lower as foreign
trade flows in the region reduced opportunities in
both retail and commercial foreign exchange
dealings. Other income was sharply higher than in
1999 following the receipt of income from Saudi
British Bank.
Operating expenses, particularly staff costs,
were 8 per cent higher than in 1999. The increase in
staff costs reflected increased headcount resulting
from the expansion of personal banking direct sales
teams around the region and the introduction of
qualified personal financial planning staff in the
UAE as part of HSBC’s wealth management strategy.
The charge for bad and doubtful debts during the
year was sharply lower than in 1999 reflecting a
smaller number of significant individual provisions,
and an improvement in vehicle finance delinquencies
in the UAE.
Elsewhere, operations in Indonesia, Korea and
Thailand each contributed in excess of US$50
million pre-tax profits. In addition, operations in
Taiwan, the Philippines and Australia, each
contributed in excess of US$25 million to pre-tax
profits.
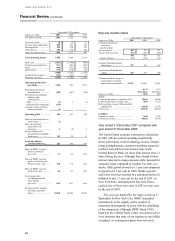
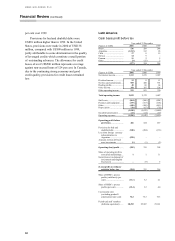
North America
Cash basis profit before tax
Year ended 31 December
Figures in US$m 2001 2000 1999
HSBC Bank USA (excl
Princeton)........................ 1,273 871 682
HSBC Markets USA ............ (6 ) 35 8
Other USA operations.......... 13 58
USA operations.................... 1,280 911 698
Canadian operations............. 230 236 165
1,510 1,147 863
Princeton Note settlement ... (575 )
–
–
Group internet
development – hsbc.com .(161 )
–
–
Intermediate holding
companies ....................... (151) (154) 99
623 993 962