HSBC 2001 Annual Report Download - page 258
Download and view the complete annual report
Please find page 258 of the 2001 HSBC annual report below. You can navigate through the pages in the report by either clicking on the pages listed below, or by using the keyword search tool below to find specific information within the annual report.-
 1
1 -
2
-
3
-
4
-
5
-
6
-
7
-
8
-
9
-
10
-
11
-
12
-
13
-
14
-
15
-
16
-
17
-
18
-
19
-
20
-
21
-
22
-
23
-
24
-
25
-
26
-
27
-
28
-
29
-
30
-
31
-
32
-
33
-
34
-
35
-
36
-
37
-
38
-
39
-
40
-
41
-
42
-
43
-
44
-
45
-
46
-
47
-
48
-
49
-
50
-
51
-
52
-
53
-
54
-
55
-
56
-
57
-
58
-
59
-
60
-
61
-
62
-
63
-
64
-
65
-
66
-
67
-
68
-
69
-
70
-
71
-
72
-
73
-
74
-
75
-
76
-
77
-
78
-
79
-
80
-
81
-
82
-
83
-
84
-
85
-
86
-
87
-
88
-
89
-
90
-
91
-
92
-
93
-
94
-
95
-
96
-
97
-
98
-
99
-
100
-
101
-
102
-
103
-
104
-
105
-
106
-
107
-
108
-
109
-
110
-
111
-
112
-
113
-
114
-
115
-
116
-
117
-
118
-
119
-
120
-
121
-
122
-
123
-
124
-
125
-
126
-
127
-
128
-
129
-
130
-
131
-
132
-
133
-
134
-
135
-
136
-
137
-
138
-
139
-
140
-
141
-
142
-
143
-
144
-
145
-
146
-
147
-
148
-
149
-
150
-
151
-
152
-
153
-
154
-
155
-
156
-
157
-
158
-
159
-
160
-
161
-
162
-
163
-
164
-
165
-
166
-
167
-
168
-
169
-
170
-
171
-
172
-
173
-
174
-
175
-
176
-
177
-
178
-
179
-
180
-
181
-
182
-
183
-
184
-
185
-
186
-
187
-
188
-
189
-
190
-
191
-
192
-
193
-
194
-
195
-
196
-
197
-
198
-
199
-
200
-
201
-
202
-
203
-
204
-
205
-
206
-
207
-
208
-
209
-
210
-
211
-
212
-
213
-
214
-
215
-
216
-
217
-
218
-
219
-
220
-
221
-
222
-
223
-
224
-
225
-
226
-
227
-
228
-
229
-
230
-
231
-
232
-
233
-
234
-
235
-
236
-
237
-
238
-
239
-
240
-
241
-
242
-
243
-
244
-
245
-
246
-
247
-
 248
248 -
 249
249 -
 250
250 -
 251
251 -
 252
252 -
 253
253 -
 254
254 -
 255
255 -
 256
256 -
 257
257 -
 258
258 -
 259
259 -
 260
260 -
 261
261 -
 262
262 -
 263
263 -
 264
264 -
 265
265 -
 266
266 -
 267
267 -
 268
268 -
269
-
270
-
271
-
272
-
273
-
274
-
275
-
276
-
277
-
278
-
279
-
280
-
281
-
282
-
283
-
284
 |
 |

HSBC HOLDINGS PLC
Notes on the Financial Statements (continued)
256
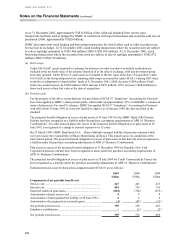
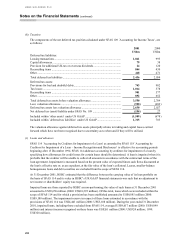
Plan asset valuations are as at 31 December with the exception of the 2000 HSBC Bank (UK) Pension Scheme
plan assets which are valued as at 30 September.
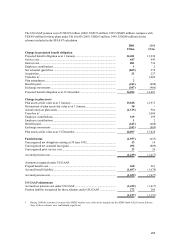
In 2001, plans with an aggregate accumulated benefit obligation of US$11,406 million (2000: US$411 million)
and assets with an aggregate fair value of US$10,508 million (2000: US$ nil) had an accumulated benefit
obligation in excess of plan assets.
Plans with an aggregate projected benefit obligation of US$13,255 million (2000: US$12,949 million) and
assets with an aggregate fair value of US$11,282 million (2000: US$12,210 million) had a projected benefit
obligation in excess of plan assets.
Plan assets are invested primarily in equities, fixed interest securities and property.
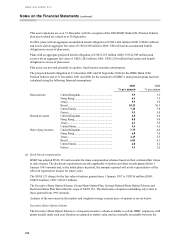
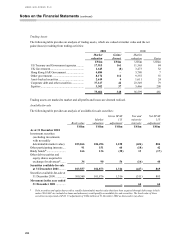
The projected benefit obligation at 31 December 2001 and 30 September 2000 for the HSBC Bank (UK)
Pension Scheme and at 31 December 2001 and 2000 for the remainder of HSBC’ s main pension plans has been
calculated using the following financial assumptions:
2001 2000
% per annum % per annum
Discount rate United Kingdom............................................ 5.9 5.5
Hong Kong.................................................... 6.5 7.5
Jersey............................................................. 5.9 5.0
Brazil............................................................. 10.25 10.3
United States ................................................. 7.25 7.8
France............................................................ 5.5 5.0
Return on assets United Kingdom............................................ 6.8 6.0
Hong Kong.................................................... 8.0 9.0
Jersey............................................................. 6.3 5.0
United States ................................................. 9.5 9.5
Rate of pay increase United Kingdom............................................ 3.75 4.0
Hong Kong.................................................... 6.0 7.0
Jersey............................................................. 4.25 2.5
Brazil............................................................. 6.05 6.1
United States ................................................. 4.0 5.2
France............................................................ 3.5 2.5
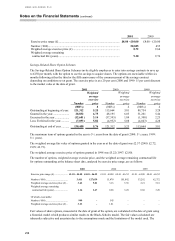
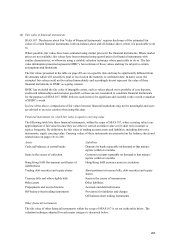
(c) Stock-based compensation
HSBC has adopted SFAS 123 and accounts for share compensation schemes based on their estimated fair values
at date of grant. The disclosure requirements are only applicable to options and other awards granted from 1
January 1995 onwards and, in the initial phase-in period, the amounts reported will not be representative of the
effect on reported net income for future years.
The SFAS 123 charge for the fair value of options granted since 1 January 1997 is US$316 million (2000:
US$234 million; 1999: US$133 million).
The Executive Share Option Scheme, Group Share Option Plan, Savings-Related Share Option Scheme and
Restricted Share Plan fall within the scope of SFAS 123. The disclosures of options outstanding only relate to
those granted from 1995 onwards.
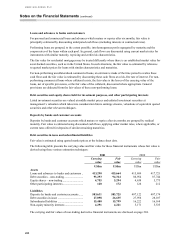
Analysis of the movement in the number and weighted average exercise price of options is set out below.
Executive Share Option Scheme
The Executive Share Option Scheme is a long-term incentive scheme available to certain HSBC employees with
grants usually made each year. Options are granted at market value and are normally exercisable between the