HSBC 2001 Annual Report Download - page 231
Download and view the complete annual report
Please find page 231 of the 2001 HSBC annual report below. You can navigate through the pages in the report by either clicking on the pages listed below, or by using the keyword search tool below to find specific information within the annual report.-
 1
1 -
2
-
3
-
4
-
5
-
6
-
7
-
8
-
9
-
10
-
11
-
12
-
13
-
14
-
15
-
16
-
17
-
18
-
19
-
20
-
21
-
22
-
23
-
24
-
25
-
26
-
27
-
28
-
29
-
30
-
31
-
32
-
33
-
34
-
35
-
36
-
37
-
38
-
39
-
40
-
41
-
42
-
43
-
44
-
45
-
46
-
47
-
48
-
49
-
50
-
51
-
52
-
53
-
54
-
55
-
56
-
57
-
58
-
59
-
60
-
61
-
62
-
63
-
64
-
65
-
66
-
67
-
68
-
69
-
70
-
71
-
72
-
73
-
74
-
75
-
76
-
77
-
78
-
79
-
80
-
81
-
82
-
83
-
84
-
85
-
86
-
87
-
88
-
89
-
90
-
91
-
92
-
93
-
94
-
95
-
96
-
97
-
98
-
99
-
100
-
101
-
102
-
103
-
104
-
105
-
106
-
107
-
108
-
109
-
110
-
111
-
112
-
113
-
114
-
115
-
116
-
117
-
118
-
119
-
120
-
121
-
122
-
123
-
124
-
125
-
126
-
127
-
128
-
129
-
130
-
131
-
132
-
133
-
134
-
135
-
136
-
137
-
138
-
139
-
140
-
141
-
142
-
143
-
144
-
145
-
146
-
147
-
148
-
149
-
150
-
151
-
152
-
153
-
154
-
155
-
156
-
157
-
158
-
159
-
160
-
161
-
162
-
163
-
164
-
165
-
166
-
167
-
168
-
169
-
170
-
171
-
172
-
173
-
174
-
175
-
176
-
177
-
178
-
179
-
180
-
181
-
182
-
183
-
184
-
185
-
186
-
187
-
188
-
189
-
190
-
191
-
192
-
193
-
194
-
195
-
196
-
197
-
198
-
199
-
200
-
201
-
202
-
203
-
204
-
205
-
206
-
207
-
208
-
209
-
210
-
211
-
212
-
213
-
214
-
215
-
216
-
217
-
218
-
219
-
220
-
 221
221 -
 222
222 -
 223
223 -
 224
224 -
 225
225 -
 226
226 -
 227
227 -
 228
228 -
 229
229 -
 230
230 -
 231
231 -
 232
232 -
 233
233 -
 234
234 -
 235
235 -
 236
236 -
 237
237 -
 238
238 -
 239
239 -
 240
240 -
 241
241 -
242
-
243
-
244
-
245
-
246
-
247
-
248
-
249
-
250
-
251
-
252
-
253
-
254
-
255
-
256
-
257
-
258
-
259
-
260
-
261
-
262
-
263
-
264
-
265
-
266
-
267
-
268
-
269
-
270
-
271
-
272
-
273
-
274
-
275
-
276
-
277
-
278
-
279
-
280
-
281
-
282
-
283
-
284
 |
 |

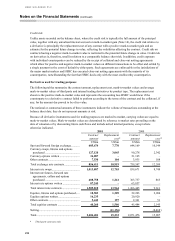
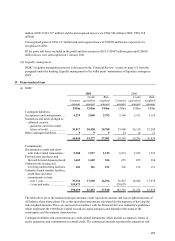
229
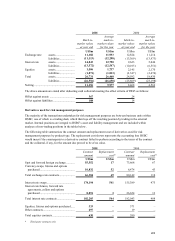
Trading VAR for HSBC for 2000 was:
Combined
HSBC Excluding former Republic operations
At 31
December
2000
At 31
December
2000
Minimum
during the
year
Maximum
during the
year
Average for
the year
US$m US$m US$m US$m US$m
Total trading activities ............ 75.0 64.8 44.5 83.7 63.1
Foreign exchange trading
positions .............................. 19.1 17.2 8.9 26.8 16.6
Interest rate trading positions.. 58.9 45.0 32.2 66.4 46.9
Equities trading positions........ 39.9 39.9 23.6 53.4 36.1
Trading VAR for CCF is included in the above table from the date of acquisition.
Trading VAR for the former Republic operations at 31 December 2000 was US$23.2 million on a variance/co-
variance basis. On a historical simulation approach, trading VAR for the former Republic operations at 31
December 2000 was US$11.7 million, the maximum during 2000 was US$37.1 million, the minimum US$9.3
million and the average US$18.8 million. The scope of calculation of VAR on a historical simulation approach
was refined at 30 June 2000, following a review of its basis, to be more consistent with that of the rest of HSBC.
The maximum, minimum and average on a historical simulation approach for each half year are set out below:
Former Republic operations
Total trading
First half 2000 Second half 2000
US$m US$m
Maximum for the half-year......................................... 37.1 19.1
Minimum for the half-year.......................................... 12.5 9.3
Average for the half-year ............................................ 22.7 13.6
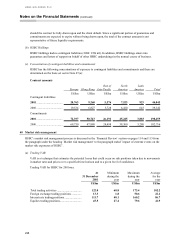
The VAR noted for foreign exchange positions excludes structural foreign currency exposures, since related
gains or losses are taken through reserves.
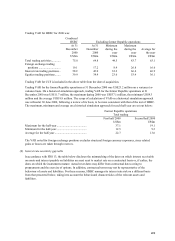
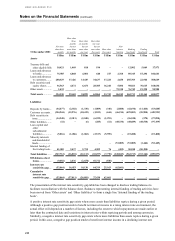
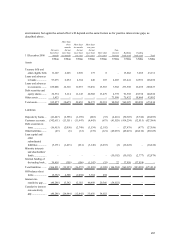
(b) Interest rate sensitivity gap table
In accordance with FRS 13, the table below discloses the mismatching of the dates on which interest receivable
on assets and interest payable on liabilities are next reset to market rate on a contractual basis or, if earlier, the
dates on which the instruments mature. Actual reset dates may differ from contractual dates owing to
prepayments and the exercise of options. In addition, contractual terms may not be representative of the
behaviour of assets and liabilities. For these reasons, HSBC manages its interest rate risk on a different basis
from that presented below, taking into account the behavioural characteristics of the relevant assets and
liabilities.