Entergy 2012 Annual Report Download - page 99
Download and view the complete annual report
Please find page 99 of the 2012 Entergy annual report below. You can navigate through the pages in the report by either clicking on the pages listed below, or by using the keyword search tool below to find specific information within the annual report.-
 1
1 -
2
-
3
-
4
-
5
-
6
-
7
-
8
-
9
-
10
-
11
-
12
-
13
-
14
-
15
-
16
-
17
-
18
-
19
-
20
-
21
-
22
-
23
-
24
-
25
-
26
-
27
-
28
-
29
-
30
-
31
-
32
-
33
-
34
-
35
-
36
-
37
-
38
-
39
-
40
-
41
-
42
-
43
-
44
-
45
-
46
-
47
-
48
-
49
-
50
-
51
-
52
-
53
-
54
-
55
-
56
-
57
-
58
-
59
-
60
-
61
-
62
-
63
-
64
-
65
-
66
-
67
-
68
-
69
-
70
-
71
-
72
-
73
-
74
-
75
-
76
-
77
-
78
-
79
-
80
-
81
-
82
-
83
-
84
-
85
-
86
-
87
-
88
-
 89
89 -
 90
90 -
 91
91 -
 92
92 -
 93
93 -
 94
94 -
 95
95 -
 96
96 -
 97
97 -
 98
98 -
 99
99 -
 100
100 -
 101
101 -
 102
102 -
 103
103 -
 104
104 -
 105
105 -
 106
106 -
 107
107 -
 108
108 -
 109
109 -
110
-
111
-
112
 |
 |

Entergy Corporation and Subsidiaries 2012
NOTES TO CONSOLIDATED FINANCIAL STATEMENTS continued
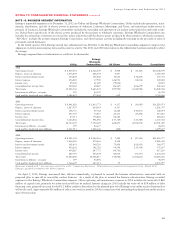
NOTE 13. BUSINESS SEGMENT INFORMATION
Entergy’s reportable segments as of December 31, 2012 are Utility and Entergy Wholesale Commodities. Utility includes the generation, trans-
mission, distribution, and sale of electric power in portions of Arkansas, Louisiana, Mississippi, and Texas, and natural gas utility service in
portions of Louisiana. Entergy Wholesale Commodities includes the ownership and operation of six nuclear power plants located in the north-
ern United States and the sale of the electric power produced by those plants to wholesale customers. Entergy Wholesale Commodities also
includes the ownership of interests in non-nuclear power plants that sell the electric power produced by those plants to wholesale customers.
“All Other” includes the parent company, Entergy Corporation, and other business activity, including the earnings on the proceeds of sales of
previously-owned businesses.
In the fourth quarter 2012, Entergy moved two subsidiaries from All Other to the Entergy Wholesale Commodities segment to improve the
alignment of certain intercompany items and income tax activity. The 2011 and 2010 information in the tables below has been restated to reflect
the change.
Entergy’s segment financial information is as follows (in thousands):
Entergy
Wholesale
Utility Commodities* All Others Eliminations Consolidated
2012
Operating revenues $ 8,005,091 $ 2,326,309 $ 4,048 $ (33,369) $10,302,079
Deprec., amort. & decomm. 1,076,845 248,143 4,357 – 1,329,345
Interest and investment income 150,292 105,062 30,656 (158,234) 127,776
Interest expense 476,485 17,900 126,913 (52,014) 569,284
Income taxes 49,340 61,329 (79,814) – 30,855
Consolidated net income (loss) 960,322 40,427 (26,167) (106,219) 868,363
Total assets 35,438,130 9,623,345 (509,985) (1,348,988) 43,202,502
Investment in affiliates - at equity 199 46,539 – – 46,738
Cash paid for long-lived asset additions 3,182,695 577,652 619 – 3,760,966
2011
Operating revenues $ 8,841,828 $ 2,413,773 $ 4,157 $ (30,685) $11,229,073
Deprec., amort. & decomm. 1,027,597 260,643 4,557 – 1,292,797
Interest and investment income 158,737 99,762 16,368 (145,873) 128,994
Interest expense 455,739 33,067 60,113 (35,292) 513,627
Income taxes 27,311 176,286 82,666 – 286,263
Consolidated net income (loss) 1,123,866 491,846 (137,760) (110,580) 1,367,372
Total assets 32,734,549 9,796,529 228,691 (2,058,070) 40,701,699
Investment in affiliates - at equity 199 44,677 – – 44,876
Cash paid for long-lived asset additions 2,351,913 1,048,146 (402) – 3,399,657
2010
Operating revenues $ 8,941,332 $ 2,566,156 $ 7,442 $ (27,353) $11,487,577
Deprec., amort. & decomm. 1,006,385 270,663 4,582 – 1,281,630
Interest and investment income 182,493 140,729 73,808 (212,953) 184,077
Interest expense 493,241 102,728 98,594 (119,396) 575,167
Income taxes 454,227 247,775 (84,763) – 617,239
Consolidated net income 829,719 450,104 84,039 (93,557) 1,270,305
Total assets 31,080,240 10,102,817 (714,968) (1,782,813) 38,685,276
Investment in affiliates - at equity 199 40,498 – – 40,697
Cash paid for long-lived asset additions 1,766,609 687,313 75 – 2,453,997
Businesses marked with * are sometimes referred to as the “competitive businesses.” Eliminations are primarily intersegment activity. Almost all of
Entergy’s goodwill is related to the Utility segment.
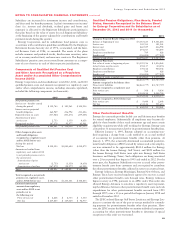
On April 5, 2010, Entergy announced that, effective immediately, it planned to unwind the business infrastructure associated with its
proposed plan to spin-off its non-utility nuclear business. As a result of the plan to unwind the business infrastructure, Entergy recorded
expenses in the Entergy Wholesale Commodities segment. Other operating and maintenance expense in 2010 includes the write-off of $64
million of capital costs, primarily for software that will not be utilized. Interest charges in 2010 include the write-off of $39 million of debt
financing costs, primarily incurred for the $1.2 billion credit facility related to the planned spin-off of Entergy’s non-utility nuclear business that
will not be used. Approximately $16 million of other costs were incurred in 2010 in connection with unwinding the planned non-utility nuclear
spin-off transaction.
97