Entergy 2012 Annual Report Download - page 93
Download and view the complete annual report
Please find page 93 of the 2012 Entergy annual report below. You can navigate through the pages in the report by either clicking on the pages listed below, or by using the keyword search tool below to find specific information within the annual report.-
 1
1 -
2
-
3
-
4
-
5
-
6
-
7
-
8
-
9
-
10
-
11
-
12
-
13
-
14
-
15
-
16
-
17
-
18
-
19
-
20
-
21
-
22
-
23
-
24
-
25
-
26
-
27
-
28
-
29
-
30
-
31
-
32
-
33
-
34
-
35
-
36
-
37
-
38
-
39
-
40
-
41
-
42
-
43
-
44
-
45
-
46
-
47
-
48
-
49
-
50
-
51
-
52
-
53
-
54
-
55
-
56
-
57
-
58
-
59
-
60
-
61
-
62
-
63
-
64
-
65
-
66
-
67
-
68
-
69
-
70
-
71
-
72
-
73
-
74
-
75
-
76
-
77
-
78
-
79
-
80
-
81
-
82
-
 83
83 -
 84
84 -
 85
85 -
 86
86 -
 87
87 -
 88
88 -
 89
89 -
 90
90 -
 91
91 -
 92
92 -
 93
93 -
 94
94 -
 95
95 -
 96
96 -
 97
97 -
 98
98 -
 99
99 -
 100
100 -
 101
101 -
 102
102 -
 103
103 -
104
-
105
-
106
-
107
-
108
-
109
-
110
-
111
-
112
 |
 |

Entergy Corporation and Subsidiaries 2012
NOTES TO CONSOLIDATED FINANCIAL STATEMENTS continued
December 31, 2012 and $58.9 million at December 31, 2011) and
accumulated other comprehensive income before taxes ($32.5 mil-
lion at December 31, 2012 and $27.2 million at December 31, 2011).
Accounting for Pension and Other
Postretirement Benefits
Accounting standards require an employer to recognize in its balance
sheet the funded status of its benefit plans. This is measured as the
difference between plan assets at fair value and the benefit obligation.
Entergy uses a December 31 measurement date for its pension and
other postretirement plans. Employers are to record previously
unrecognized gains and losses, prior service costs, and any remaining
transition asset or obligation (that resulted from adopting prior
pension and other postretirement benefits accounting standards) as
comprehensive income and/or as a regulatory asset reflective of the
recovery mechanism for pension and other postretirement benefit costs
in the Registrant Subsidiaries’ respective regulatory jurisdictions. For
the portion of Entergy Gulf States Louisiana that is not regulated, the
unrecognized prior service cost, gains and losses, and transition asset/
obligation for its pension and other postretirement benefit obligations
are recorded as other comprehensive income. Entergy Gulf States
Louisiana and Entergy Louisiana recover other postretirement benefit
costs on a pay as you go basis and record the unrecognized prior
service cost, gains and losses, and transition obligation for its other
postretirement benefit obligation as other comprehensive income.
Accounting standards also requires that changes in the funded status
be recorded as other comprehensive income and/or a regulatory asset
in the period in which the changes occur.
With regard to pension and other postretirement costs, Entergy
calculates the expected return on pension and other postretirement
benefit plan assets by multiplying the long-term expected rate of
return on assets by the market-related value (MRV) of plan assets.
Entergy determines the MRV of pension plan assets by calculating a
value that uses a 20-quarter phase-in of the difference between actual
and expected returns. For other postretirement benefit plan assets
Entergy uses fair value when determining MRV.
Qualified Pension and Other Postretirement
Plans’ Assets
The Plan Administrator’s trust asset investment strategy is to invest
the assets in a manner whereby long-term earnings on the assets
(plus cash contributions) provide adequate funding for retiree benefit
payments. The mix of assets is based on an optimization study that
identifies asset allocation targets in order to achieve the maximum
return for an acceptable level of risk, while minimizing the expected
contributions and pension and postretirement expense.
In the optimization studies, the Plan Administrator formulates
assumptions about characteristics, such as expected asset class invest-
ment returns, volatility (risk), and correlation coefficients among the
various asset classes. The future market assumptions used in the opti-
mization study are determined by examining historical market charac-
teristics of the various asset classes, and making adjustments to reflect
future conditions expected to prevail over the study period. Target
asset allocations adjust dynamically based on the funded status of the
pension plans. The following targets and ranges were established to
produce an acceptable, economically efficient plan to manage around
the targets. The target asset allocation range below for pension shows
the ranges within which the allocation may adjust based on funded
status, with the expectation that the allocation to fixed-income secu-
rities will increase as the pension funded status increases. The target
and range asset allocation for postretirement assets reflects changes
made in 2012 as recommended in the latest optimization study.
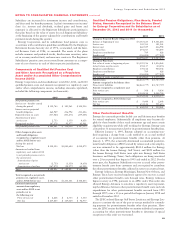
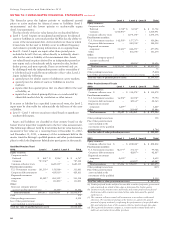
Entergy’s qualified pension and postretirement weighted-average
asset allocations by asset category at December 31, 2012 and 2011 and
the target asset allocation and ranges are as follows (in percentages):
Actual Actual
Pension Asset Allocation Target Range 2012 2011
Domestic Equity Securities 45 34 to 53 44 44
International Equity Securities 20 16 to 24 20 18
Fixed-Income Securities 35 31 to 41 35 37
Other – – to 10 1 1
Postretirement Non-Taxable Taxable
Asset Allocation Target Range 2012 2011 Target Range 2012 2011
Domestic
Equity Securities 39 34 to 44 38 39 39 34 to 44 39 35
International
Equity Securities 26 21 to 31 28 15 26 21 to 31 27 –
Fixed-Income
Securities 35 30 to 40 34 46 35 30 to 40 34 64
Other – – to 5 – – – – to 5 – 1
In determining its expected long-term rate of return on plan assets
used in the calculation of benefit plan costs, Entergy reviews past perfor-
mance, current and expected future asset allocations, and capital mar-
ket assumptions of its investment consultant and investment managers.
The expected long-term rate of return for the qualified pension
plans’ assets is based primarily on the geometric average of the his-
torical annual performance of a representative portfolio weighted by
the target asset allocation defined in the table above, along with other
indications of expected return on current assets and expected return
available for reinvestment. The time period reflected is a long dated
period spanning several decades.
The expected long-term rate of return for the non-taxable post-
retirement trust assets is determined using the same methodology
described above for pension assets, but the asset allocation specific to
the non-taxable postretirement assets is used.
For the taxable postretirement trust assets, the investment alloca-
tion includes tax-exempt fixed-income securities. This asset allocation
in combination with the same methodology employed to determine
the expected return for other trust assets (as described above), with a
modification to reflect applicable taxes, is used to produce the expected
long-term rate of return for taxable postretirement trust assets.
Concentrations of Credit Risk
Entergy’s investment guidelines mandate the avoidance of risk con-
centrations. Types of concentrations specified to be avoided include,
but are not limited to, investment concentrations in a single entity,
type of industry, foreign country, geographic area and individual
security issuance. As of December 31, 2012 all investment managers
and assets were materially in compliance with the approved invest-
ment guidelines, therefore there were no significant concentrations
(defined as greater than 10 percent of plan assets) of risk in Entergy’s
pension and other postretirement benefit plan assets.
The Plan Administrator’s trust asset investment strategy is to invest
the assets in a manner whereby long-term earnings on the assets
(plus cash contributions) provide adequate funding for retiree benefit
payments. The mix of assets is based on an optimization study that
identifies asset allocation targets in order to achieve the maximum
return for an acceptable level of risk, while minimizing the expected
contributions and pension and postretirement expense.
Fair Value Measurements
Accounting standards provide the framework for measuring
fair value. That framework provides a fair value hierarchy that
prioritizes the inputs to valuation techniques used to measure fair value.
91