Entergy 2012 Annual Report Download - page 56
Download and view the complete annual report
Please find page 56 of the 2012 Entergy annual report below. You can navigate through the pages in the report by either clicking on the pages listed below, or by using the keyword search tool below to find specific information within the annual report.-
 1
1 -
2
-
3
-
4
-
5
-
6
-
7
-
8
-
9
-
10
-
11
-
12
-
13
-
14
-
15
-
16
-
17
-
18
-
19
-
20
-
21
-
22
-
23
-
24
-
25
-
26
-
27
-
28
-
29
-
30
-
31
-
32
-
33
-
34
-
35
-
36
-
37
-
38
-
39
-
40
-
41
-
42
-
43
-
44
-
45
-
 46
46 -
 47
47 -
 48
48 -
 49
49 -
 50
50 -
 51
51 -
 52
52 -
 53
53 -
 54
54 -
 55
55 -
 56
56 -
 57
57 -
 58
58 -
 59
59 -
 60
60 -
 61
61 -
 62
62 -
 63
63 -
 64
64 -
 65
65 -
 66
66 -
67
-
68
-
69
-
70
-
71
-
72
-
73
-
74
-
75
-
76
-
77
-
78
-
79
-
80
-
81
-
82
-
83
-
84
-
85
-
86
-
87
-
88
-
89
-
90
-
91
-
92
-
93
-
94
-
95
-
96
-
97
-
98
-
99
-
100
-
101
-
102
-
103
-
104
-
105
-
106
-
107
-
108
-
109
-
110
-
111
-
112
 |
 |

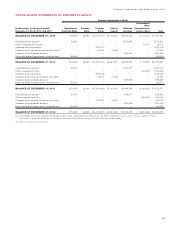
Entergy Corporation and Subsidiaries 2012
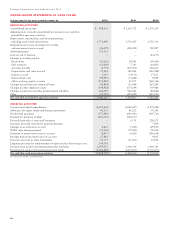
CONSOLIDATED STATEMENTS OF CASH FLOWS
In thousands, for the years ended December 31, 2012 2011 2010
OPERATING ACTIVITIES
Consolidated net income $ 868,363 $ 1,367,372 $ 1,270,305
Adjustments to reconcile consolidated net income to net cash flow
provided by operating activities:
Depreciation, amortization, and decommissioning,
including nuclear fuel amortization 1,771,649 1,745,455 1,705,331
Deferred income taxes, investment tax credits,
and non-current taxes accrued (26,479) (280,029) 718,987
Asset impairment 355,524 – –
Gain on sale of business – – (44,173)
Changes in working capital:
Receivables (14,202) 28,091 (99,640)
Fuel inventory (11,604) 5,393 (10,665)
Accounts payable (6,779) (131,970) 216,635
Prepaid taxes and taxes accrued 55,484 580,042 (116,988)
Interest accrued 1,152 (34,172) 17,651
Deferred fuel costs (99,987) (55,686) 8,909
Other working capital accounts (151,989) 41,875 (160,326)
Changes in provisions for estimated losses (24,808) (11,086) 265,284
Changes in other regulatory assets (398,428) (673,244) 339,408
Changes in pensions and other postretirement liabilities 644,099 962,461 (80,844)
Other (21,710) (415,685) (103,793)
Net cash flow provided by operating activities 2,940,285 3,128,817 3,926,081
INVESTING ACTIVITIES
Construction/capital expenditures (2,674,650) (2,040,027) (1,974,286)
Allowance for equity funds used during construction 96,131 86,252 59,381
Nuclear fuel purchases (557,960) (641,493) (407,711)
Payment for purchase of plant (456,356) (646,137) –
Proceeds from sale of assets and businesses – 6,531 228,171
Insurance proceeds received for property damages – – 7,894
Changes in securitization account 4,265 (7,260) (29,945)
NYPA value sharing payment (72,000) (72,000) (72,000)
Payments to storm reserve escrow account (8,957) (6,425) (296,614)
Receipts from storm reserve escrow account 27,884 – 9,925
Decrease (increase) in other investments 15,175 (11,623) 24,956
Litigation proceeds for reimbursement of spent nuclear fuel storage costs 109,105 – –
Proceeds from nuclear decommissioning trust fund sales 2,074,055 1,360,346 2,606,383
Investment in nuclear decommissioning trust funds (2,196,489) (1,475,017) (2,730,377)
Net cash flow used in investing activities (3,639,797) (3,446,853) (2,574,223)
See Notes to Financial Statements.
54