Entergy 2012 Annual Report Download - page 102
Download and view the complete annual report
Please find page 102 of the 2012 Entergy annual report below. You can navigate through the pages in the report by either clicking on the pages listed below, or by using the keyword search tool below to find specific information within the annual report.-
 1
1 -
2
-
3
-
4
-
5
-
6
-
7
-
8
-
9
-
10
-
11
-
12
-
13
-
14
-
15
-
16
-
17
-
18
-
19
-
20
-
21
-
22
-
23
-
24
-
25
-
26
-
27
-
28
-
29
-
30
-
31
-
32
-
33
-
34
-
35
-
36
-
37
-
38
-
39
-
40
-
41
-
42
-
43
-
44
-
45
-
46
-
47
-
48
-
49
-
50
-
51
-
52
-
53
-
54
-
55
-
56
-
57
-
58
-
59
-
60
-
61
-
62
-
63
-
64
-
65
-
66
-
67
-
68
-
69
-
70
-
71
-
72
-
73
-
74
-
75
-
76
-
77
-
78
-
79
-
80
-
81
-
82
-
83
-
84
-
85
-
86
-
87
-
88
-
89
-
90
-
91
-
 92
92 -
 93
93 -
 94
94 -
 95
95 -
 96
96 -
 97
97 -
 98
98 -
 99
99 -
 100
100 -
 101
101 -
 102
102 -
 103
103 -
 104
104 -
 105
105 -
 106
106 -
 107
107 -
 108
108 -
 109
109 -
 110
110 -
 111
111 -
 112
112
 |
 |

Entergy Corporation and Subsidiaries 2012
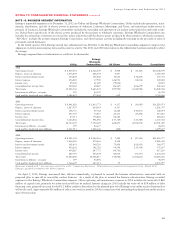
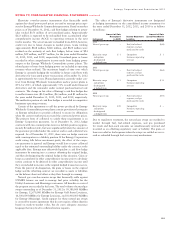
Derivatives
The fair values of Entergy’s derivative instruments in the consolidated balance sheet as of December 31, 2012 are as follows (in millions):
Instrument Balance Sheet Location Fair Value(a) Offset(a) Business
Derivatives designated as hedging instruments
Assets:
Electricity swaps and options Prepayments and other (current portion) $123 $ (–) Entergy Wholesale Commodities
Electricity swaps and options Other deferred debits and other assets
(non-current portion) $ 46 $(10) Entergy Wholesale Commodities
Liabilities:
Electricity swaps and options Other non-current liabilities
(non-current portion) $ 18 $(11) Entergy Wholesale Commodities
Derivatives not designated as hedging instruments
Assets:
Electricity swaps and options Prepayments and other (current portion) $ 22 $ (–) Entergy Wholesale Commodities
Electricity swaps, and options Other deferred debits and other assets
(non-current portion) $ 24 $(14) Entergy Wholesale Commodities
Liabilities:
Electricity swaps and options Other non-current liabilities
(non-current portion) $ 19 $(13) Entergy Wholesale Commodities
Natural gas swaps Other current liabilities $ 8 $ (–) Utility
The fair values of Entergy’s derivative instruments in the consolidated balance sheet as of December 31, 2011 are as follows (in millions):
Instrument Balance Sheet Location Fair Value(a) Offset(a) Business
Derivatives designated as hedging instruments
Assets:
Electricity swaps and options Prepayments and other (current portion) $197 $(25) Entergy Wholesale Commodities
Electricity swaps and options Other deferred debits and other assets
(non-current portion) $112 $ (1) Entergy Wholesale Commodities
Liabilities:
Electricity swaps and options Other non-current liabilities
(non-current portion) $ 1 $ (1) Entergy Wholesale Commodities
Derivatives not designated as hedging instruments
Assets:
Electricity swaps and options Prepayments and other (current portion) $ 37 $ (8) Entergy Wholesale Commodities
Liabilities:
Electricity swaps and options Other current liabilities (current portion) $ 33 $(33) Entergy Wholesale Commodities
Natural gas swaps Other current liabilities $ 30 $ (–) Utility
(a) The balances of derivative assets and liabilities in these tables are presented gross. Certain investments, including those not designated as hedging instruments, are
subject to master netting agreements and are presented on the Entergy Consolidated Balance Sheets on a net basis in accordance with accounting guidance for
Derivatives and Hedging.
The effect of Entergy’s derivative instruments designated as cash flow hedges on the consolidated income statements for the years ended
December 31, 2012, 2011, and 2010 are as follows (in millions):
Amount of Gain Amount of Gain
Recognized in Other Reclassified From
Instrument Comprehensive Income Income Statement Location AOCI Into Income
2012
Electricity swaps and options $111 Competitive businesses operating revenues $268
2011
Electricity swaps and options $296 Competitive businesses operating revenues $168
2010
Electricity swaps and options $206 Competitive businesses operating revenues $220
NOTES TO CONSOLIDATED FINANCIAL STATEMENTS continued
100