Entergy 2012 Annual Report Download - page 30
Download and view the complete annual report
Please find page 30 of the 2012 Entergy annual report below. You can navigate through the pages in the report by either clicking on the pages listed below, or by using the keyword search tool below to find specific information within the annual report.-
 1
1 -
2
-
3
-
4
-
5
-
6
-
7
-
8
-
9
-
10
-
11
-
12
-
13
-
14
-
15
-
16
-
17
-
18
-
19
-
 20
20 -
 21
21 -
 22
22 -
 23
23 -
 24
24 -
 25
25 -
 26
26 -
 27
27 -
 28
28 -
 29
29 -
 30
30 -
 31
31 -
 32
32 -
 33
33 -
 34
34 -
 35
35 -
 36
36 -
 37
37 -
 38
38 -
 39
39 -
 40
40 -
41
-
42
-
43
-
44
-
45
-
46
-
47
-
48
-
49
-
50
-
51
-
52
-
53
-
54
-
55
-
56
-
57
-
58
-
59
-
60
-
61
-
62
-
63
-
64
-
65
-
66
-
67
-
68
-
69
-
70
-
71
-
72
-
73
-
74
-
75
-
76
-
77
-
78
-
79
-
80
-
81
-
82
-
83
-
84
-
85
-
86
-
87
-
88
-
89
-
90
-
91
-
92
-
93
-
94
-
95
-
96
-
97
-
98
-
99
-
100
-
101
-
102
-
103
-
104
-
105
-
106
-
107
-
108
-
109
-
110
-
111
-
112
 |
 |

Entergy Corporation and Subsidiaries 2012
MANAGEMENT’S FINANCIAL DISCUSSION AND ANALYSIS continued
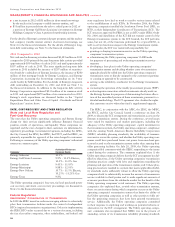
Entergy Wholesale Commodities
Following is an analysis of the change in net revenue comparing 2011
to 2010 (in millions):
2010 Net Revenue $2,200
Nuclear realized price changes (159)
Fuel expenses (30)
Harrison County (27)
Nuclear volume 61
2011 Net Revenue $2,045
As shown in the table above, net revenue for Entergy Wholesale
Commodities decreased by $155 million, or 7%, in 2011 compared
to 2010 primarily due to:
n lower pricing in its contracts to sell power;
n higher fuel expenses, primarily at the nuclear plants; and
n the absence of the Harrison County plant, which was sold
in December 2010.
These factors were partially offset by higher volume resulting from
fewer planned and unplanned outage days in 2011 compared to the
same period in 2010.
Following are key performance measures for Entergy Wholesale
Commodities for 2011 and 2010:
2011 2010
Owned capacity 6,599 6,351
GWh billed 43,497 42,934
Average realized price per MWh $54.50 $58.69
Entergy Wholesale Commodities Nuclear Fleet
Capacity factor 93% 90%
GWh billed 40,918 39,655
Average realized revenue per MWh $54.73 $59.16
Refueling outage days:
FitzPatrick – 35
Indian Point 2 – 33
Indian Point 3 30 –
Palisades – 26
Pilgrim 25 –
Vermont Yankee 25 29
OTHER INCOME STATEMENT ITEMS
Utility
Other operation and maintenance expenses increased from $1,949
million for 2010 to $1,951 million for 2011 primarily due to:
n an increase of $17 million in nuclear expenses primarily due to
higher labor costs, including higher contract labor;
n an increase of $15 million in contract costs due to the transition
and implementation of joining the MISO RTO;
n an increase of $9 million in legal expenses primarily resulting
from an increase in legal and regulatory activity increasing the
use of outside legal services;
n an increase of $8 million in fossil-fueled generation expenses
primarily due to the addition of Acadia Unit 2 in April 2011; and
n several individually insignificant items.
These increases were substantially offset by:
n a decrease of $29 million in compensation and benefits costs
primarily resulting from an increase in the accrual for incentive-
based compensation in 2010 and a decrease in stock option
expense. The decrease in stock option expense is offset by credits
recorded by the parent company, Entergy Corporation;
n the deferral in 2011 of $13.4 million of 2010 Michoud plant
maintenance costs pursuant to the settlement of Entergy New
Orleans’ 2010 test year formula rate plan filing approved by the
City Council in September 2011. See Note 2 to the financial
statements for further discussion of the 2010 test year formula
rate plan filing and settlement;
n the amortization of $11 million of Entergy Texas rate case
expenses in 2010. See Note 2 to the financial statements for
further discussion of the Entergy Texas rate case settlement; and
n a decrease of $10 million in operating expenses due to the sale
of surplus oil inventory in 2011.
Depreciation and amortization expense increased primarily due to
an increase in plant in service, partially offset by a decrease in depre-
ciation rates at Entergy Arkansas as a result of the rate case settlement
agreement approved by the APSC in June 2010.
Interest expense decreased primarily due to:
n the refinancing of long-term debt at lower interest rates by certain
of the Utility operating companies;
n a revision caused by FERC’s acceptance of a change in the treat-
ment of funds received from independent power producers for
transmission interconnection projects; and
n interest expense accrued in 2010 related to the expected result
of the LPSC Staff audit of Entergy Gulf States Louisiana’s fuel
adjustment clause for the period 1995 through 2004.
Entergy Wholesale Commodities
Other operation and maintenance expenses decreased from $1,047
million for 2010 to $906 million for 2011 primarily due to:
n the write-off of $64 million of capital costs in 2010, primarily for
software that would not be utilized, and $16 million of additional
costs incurred in 2010 in connection with Entergy’s decision to
unwind the infrastructure created for the planned spin-off of its
non-utility nuclear business;
n a decrease of $30 million due to the absence of expenses from the
Harrison County plant, which was sold in December 2010;
n a decrease in compensation and benefits costs resulting from an
increase of $19 million in the accrual for incentive-based
compensation in 2010;
n a decrease of $12 million in spending on tritium remediation
work; and
n the write-off of $10 million of capitalized engineering costs in
2010 associated with a potential uprate project.
The gain on sale resulted from the sale in 2010 of Entergy’s owner-
ship interest in the Harrison County Power Project 550 MW com-
bined-cycle plant to two Texas electric cooperatives that owned a
minority share of the plant. Entergy sold its 61 percent share of the
plant for $219 million and realized a pre-tax gain of $44.2 million on
the sale.
Depreciation and amortization expense increased primarily due to
an increase in plant in service and declining useful life of nuclear assets.
Other income decreased primarily due to a decrease in interest
income earned on loans to the parent company, Entergy Corporation,
and a decrease of $13 million in realized earnings on decommission-
ing trust fund investments.
Interest expense decreased primarily due to the write-off of
$39 million of debt financing costs in 2010, primarily incurred for
a $1.2 billion credit facility that will not be used, in connection
with Entergy’s decision to unwind the infrastructure created for the
planned spin-off of its non-utility nuclear business.
Other expenses decreased primarily due to a credit to decommis-
sioning expense of $34 million in 2011 resulting from a reduction
in the decommissioning liability for a plant as a result of a revised
decommissioning cost study obtained to comply with a state regu-
latory requirement. See “Critical Accounting Estimates – Nuclear
Decommissioning Costs” below for further discussion of accounting
for asset retirement obligations.
28