Entergy 2012 Annual Report Download - page 26
Download and view the complete annual report
Please find page 26 of the 2012 Entergy annual report below. You can navigate through the pages in the report by either clicking on the pages listed below, or by using the keyword search tool below to find specific information within the annual report.-
 1
1 -
2
-
3
-
4
-
5
-
6
-
7
-
8
-
9
-
10
-
11
-
12
-
13
-
14
-
15
-
 16
16 -
 17
17 -
 18
18 -
 19
19 -
 20
20 -
 21
21 -
 22
22 -
 23
23 -
 24
24 -
 25
25 -
 26
26 -
 27
27 -
 28
28 -
 29
29 -
 30
30 -
 31
31 -
 32
32 -
 33
33 -
 34
34 -
 35
35 -
 36
36 -
37
-
38
-
39
-
40
-
41
-
42
-
43
-
44
-
45
-
46
-
47
-
48
-
49
-
50
-
51
-
52
-
53
-
54
-
55
-
56
-
57
-
58
-
59
-
60
-
61
-
62
-
63
-
64
-
65
-
66
-
67
-
68
-
69
-
70
-
71
-
72
-
73
-
74
-
75
-
76
-
77
-
78
-
79
-
80
-
81
-
82
-
83
-
84
-
85
-
86
-
87
-
88
-
89
-
90
-
91
-
92
-
93
-
94
-
95
-
96
-
97
-
98
-
99
-
100
-
101
-
102
-
103
-
104
-
105
-
106
-
107
-
108
-
109
-
110
-
111
-
112
 |
 |

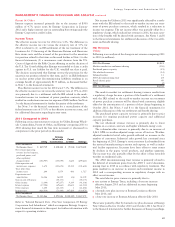
MANAGEMENT’S FINANCIAL DISCUSSION AND ANALYSIS
Entergy operates primarily through two business segments: Utility and
Entergy Wholesale Commodities.
n The UTILITY business segment includes the generation,
transmission, distribution, and sale of electric power in portions
of Arkansas, Mississippi, Texas, and Louisiana, including the
City of New Orleans; and operates a small natural gas distribution
business. As discussed in more detail in “Plan to Spin Off the
Utility’s Transmission Business,” in December 2011, Entergy
entered into an agreement to spin off its transmission business and
merge it with a newly-formed subsidiary of ITC Holdings Corp.
n The ENTERGY WHOLESALE COMMODITIES business segment
includes the ownership and operation of six nuclear power plants
located in the northern United States and the sale of the electric
power produced by those plants to wholesale customers. This
business also provides services to other nuclear power plant
owners. Entergy Wholesale Commodities also owns interests in
non-nuclear power plants that sell the electric power produced
by those plants to wholesale customers.
Following are the percentages of Entergy’s consolidated revenues
and net income generated by its operating segments and the percent-
age of total assets held by them:
% of Revenue
Segment 2012 2011 2010
Utility 78 79 78
Entergy Wholesale Commodities 22 21 22
Parent & Other – – –
% of Net Income
Segment 2012 2011 2010
Utility 110 82 65
Entergy Wholesale Commodities 5 36 36
Parent & Other (15) (18) (1)
% of Total Assets
Segment 2012 2011 2010
Utility 82 80 80
Entergy Wholesale Commodities 22 24 26
Parent & Other (4) (4) (6)
HURRICANE ISAAC
In August 2012, Hurricane Isaac caused extensive damage to por-
tions of Entergy’s service area in Louisiana, and to a lesser extent in
Mississippi and Arkansas. The storm resulted in widespread power
outages, significant damage primarily to distribution infrastructure,
and the loss of sales during the power outages. Total restoration costs
for the repair and/or replacement of Entergy’s electric facilities in
areas with damage from Hurricane Isaac are currently estimated to
be approximately $370 million, including approximate amounts of
$7 million at Entergy Arkansas, $70 million at Entergy Gulf States
Louisiana, $220 million at Entergy Louisiana, $22 million at Entergy
Mississippi, and $48 million at Entergy New Orleans.
The Utility operating companies are considering all reasonable
avenues to recover storm-related costs from Hurricane Isaac, includ-
ing, but not limited to, accessing funded storm reserves; securitiza-
tion or other alternative financing; and traditional retail recovery on
an interim and permanent basis. Each Utility operating company is
responsible for its restoration cost obligations and for recovering or
financing its storm-related costs. In November 2012, Entergy New
Orleans drew $10 million from its funded storm reserves. In January
2013, Entergy Gulf States Louisiana and Entergy Louisiana drew
$65 million and $187 million, respectively, from their funded storm
reserves. Storm cost recovery or financing may be subject to review by
applicable regulatory authorities.
Entergy recorded accruals for the estimated costs incurred that
were necessary to return customers to service. Entergy recorded
corresponding regulatory assets of approximately $120 million and
construction work in progress of approximately $250 million. Entergy
recorded the regulatory assets in accordance with its accounting poli-
cies and based on the historic treatment of such costs in its service
areas because management believes that recovery through some form
of regulatory mechanism is probable. Because Entergy has not gone
through the regulatory process regarding these storm costs, however,
there is an element of risk, and Entergy is unable to predict with
certainty the degree of success it may have in its recovery initiatives,
the amount of restoration costs that it may ultimately recover, or the
timing of such recovery.
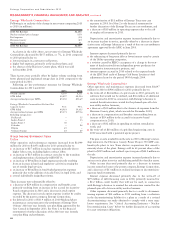
RESULTS OF OPERATIONS
2012 Compared to 2011
Following are income statement variances for Utility, Entergy Whole-
sale Commodities, Parent & Other, and Entergy comparing 2012 to
2011 showing how much the line item increased or (decreased) in
comparison to the prior period (in thousands):
Entergy
Wholesale Parent
Utility Commodities & Other Entergy
2011 Consolidated
Net Income (Loss) $1,123,866 $ 491,846 $(248,340) $1,367,372
Net revenue (operating
revenue less fuel expense,
purchased power, and
other regulatory
charges/credits) 64,531 (191,311) (4,313) (131,093)
Other operation and
maintenance expenses 128,955 52,253 (3,574) 177,634
Asset impairment – 355,524 – 355,524
Taxes other than
income taxes 803 20,675 (206) 21,272
Depreciation and
amortization 45,728 (3,145) (200) 42,383
Other income (458) 9,866 3,885 13,293
Interest expense 20,746 (15,167) 50,078 55,657
Other expenses 9,356 (25,209) – (15,853)
Income taxes 22,029 (114,957) (162,480) (255,408)
2012 Consolidated
Net Income (Loss) $ 960,322 $ 40,427 $(132,386) $ 868,363
Refer to “Selected Financial Data - Five-Year Comparison Of Entergy
Corporation And Subsidiaries” which accompanies Entergy Corpora-
tion’s financial statements in this report for further information with
respect to operating statistics.
In the fourth quarter 2012, Entergy moved two subsidiaries from
Parent & Other to the Entergy Wholesale Commodities segment to
improve the alignment of certain intercompany items and income tax
activity. The prior period financial information in this report has been
restated to reflect this change.
As discussed in more detail in Note 1 to the financial statements,
results of operations for 2012 include a $355.5 million ($223.5 mil-
lion after-tax) impairment charge to write down the carrying values
of Vermont Yankee and related assets to their fair values. Also, net
income in 2012 was significantly affected by two settlements with the
IRS; one of which related to the income tax treatment of the Louisiana
Act 55 financing of the Hurricane Katrina and Hurricane Rita storm
costs, and the other of which related to nuclear power plant decom-
missioning liabilities, both of which resulted in a reduction in income
tax expense. The net income effect was partially offset by a regulatory
charge, which reduced net revenue in 2012, associated with the storm
costs settlement to reflect the obligation to customers with respect to
the settlement. See Note 3 to the financial statements for additional
discussion of the tax settlements. Net income for Utility for 2011
was significantly affected by a settlement with the IRS related to the
Entergy Corporation and Subsidiaries 2012
24