Entergy 2012 Annual Report Download - page 94
Download and view the complete annual report
Please find page 94 of the 2012 Entergy annual report below. You can navigate through the pages in the report by either clicking on the pages listed below, or by using the keyword search tool below to find specific information within the annual report.-
 1
1 -
2
-
3
-
4
-
5
-
6
-
7
-
8
-
9
-
10
-
11
-
12
-
13
-
14
-
15
-
16
-
17
-
18
-
19
-
20
-
21
-
22
-
23
-
24
-
25
-
26
-
27
-
28
-
29
-
30
-
31
-
32
-
33
-
34
-
35
-
36
-
37
-
38
-
39
-
40
-
41
-
42
-
43
-
44
-
45
-
46
-
47
-
48
-
49
-
50
-
51
-
52
-
53
-
54
-
55
-
56
-
57
-
58
-
59
-
60
-
61
-
62
-
63
-
64
-
65
-
66
-
67
-
68
-
69
-
70
-
71
-
72
-
73
-
74
-
75
-
76
-
77
-
78
-
79
-
80
-
81
-
82
-
83
-
 84
84 -
 85
85 -
 86
86 -
 87
87 -
 88
88 -
 89
89 -
 90
90 -
 91
91 -
 92
92 -
 93
93 -
 94
94 -
 95
95 -
 96
96 -
 97
97 -
 98
98 -
 99
99 -
 100
100 -
 101
101 -
 102
102 -
 103
103 -
 104
104 -
105
-
106
-
107
-
108
-
109
-
110
-
111
-
112
 |
 |

Entergy Corporation and Subsidiaries 2012
NOTES TO CONSOLIDATED FINANCIAL STATEMENTS continued
The hierarchy gives the highest priority to unadjusted quoted
prices in active markets for identical assets or liabilities (level 1
measurements) and the lowest priority to unobservable inputs
(level 3 measurements).
The three levels of the fair value hierarchy are described below:
n Level 1 - Level 1 inputs are unadjusted quoted prices for identical
assets or liabilities in active markets that the Plan has the ability to
access at the measurement date. Active markets are those in which
transactions for the asset or liability occur in sufficient frequency
and volume to provide pricing information on an ongoing basis.
n Level 2 - Level 2 inputs are inputs other than quoted prices
included in Level 1 that are, either directly or indirectly, observ-
able for the asset or liability at the measurement date. Assets
are valued based on prices derived by an independent party that
uses inputs such as benchmark yields, reported trades, broker/
dealer quotes, and issuer spreads. Prices are reviewed and can
be challenged with the independent parties and/or overridden if
it is believed such would be more reflective of fair value. Level 2
inputs include the following:
n quoted prices for similar assets or liabilities in active markets;
n quoted prices for identical assets or liabilities in inactive
markets;
n inputs other than quoted prices that are observable for the asset
or liability; or
n inputs that are derived principally from or corroborated by
observable market data by correlation or other means.
If an asset or liability has a specified (contractual) term, the Level 2
input must be observable for substantially the full term of the asset
or liability.
n Level 3 - Level 3 refers to securities valued based on significant
unobservable inputs.
Assets and liabilities are classified in their entirety based on the
lowest level of input that is significant to the fair value measurement.
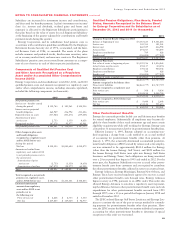
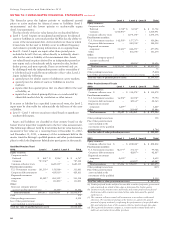
The following tables set forth by level within the fair value hierarchy,
measured at fair value on a recurring basis at December 31, 2012,
and December 31, 2011, a summary of the investments held in the
master trusts for Entergy’s qualified pension and other postretirement
plans in which the Registrant Subsidiaries participate (in thousands):
Qualified Pension Trust
2012 Level 1 Level 2 Level 3 Total
Equity securities:
Corporate stocks:
Preferred $ 861(b) $ 5,906(a) $– $ 6,767
Common 787,132(b) – – 787,132
Common collective trusts – 1,620,315(c) – 1,620,315
Fixed income securities:
U.S. Government securities 161,593(b) 150,068(a) – 311,661
Corporate debt instruments – 429,813(a) – 429,813
Registered investment
companies 50,029(d) 483,509(e) – 533,538
Other – 111,001(f) – 111,001
Other:
Insurance company general
account (unallocated contracts) – 36,252(g) – 36,252
Total investments $999,615 $2,836,864 $– $3,836,479
Cash 571
Other pending transactions 4,594
Less: Other postretirement
assets included in total investments (8,784)
Total fair value of qualified pension assets $3,832,860
2011 Level 1 Level 2 Level 3 Total
Equity securities:
Corporate stocks:
Preferred $ 3,738(b) $ 8,014(a) $– $ 11,752
Common 1,010,491(b) – – 1,010,491
Common collective trusts – 1,074,178(c) – 1,074,178
Fixed income securities:
U.S. Government securities 142,509(b) 157,737(a) – 300,246
Corporate debt instruments – 380,558(a) – 380,558
Registered investment
companies 53,323(d) 444,275(e) – 497,598
Other – 101,674(f) – 101,674
Other:
Insurance company general
account (unallocated
contracts) – 34,696(g) – 34,696
Total investments $1,210,061 $2,201,132 $– $3,411,193
Cash 75
Other pending transactions (9,238)
Less: Other postretirement assets included in total investments (2,114)
Total fair value of qualified pension assets $3,399,916
Other Postretirement Trusts
2012 Level 1 Level 2 Level 3 Total
Equity securities:
Common collective trust $ – $ 314,478(c) $– $ 314,478
Fixed income securities:
U.S. Government securities 36,392(b) 43,398(a) – 79,790
Corporate debt instruments – 42,163(a) – 42,163
Registered investment
companies 3,229(d) – – 3,229
Other – 39,846(f) – 39,846
Total investments $ 39,621 $ 439,885 $– $ 479,506
Other pending transactions 158
Plus: Other postretirement
assets included in the
investments of the qualified
pension trust 8,784
Total fair value of other postretirement assets $ 488,448
2011 Level 1 Level 2 Level 3 Total
Equity securities:
Common collective trust $ – $ 208,812(c) $– $ 208,812
Fixed income securities:
U.S. Government securities 42,577(b) 57,151(a) – 99,728
Corporate debt instruments – 42,807(a) – 42,807
Registered investment
companies 4,659(d) – – 4,659
Other – 69,287(f) – 69,287
Total investments $ 47,236 $ 378,057 $– $ 425,293
Other pending transactions (235)
Plus: Other postretirement
assets included in the
investments of the qualified
pension trust 2,114
Total fair value of other postretirement assets $ 427,172
(a) Certain preferred stocks and fixed income debt securities (corporate, government,
and securitized) are stated at fair value as determined by broker quotes.
(b) Common stocks, treasury notes and bonds, and certain preferred stocks and
fixed income debt securities are stated at fair value determined by quoted
market prices.
(c) The common collective trusts hold investments in accordance with stated
objectives. The investment strategy of the trusts is to capture the growth
potential of equity markets by replicating the performance of a specified index.
Net asset value per share of the common collective trusts estimate fair value.
(d) The registered investment company is a money market mutual fund with a
stable net asset value of one dollar per share.
92