Entergy 2012 Annual Report Download - page 2
Download and view the complete annual report
Please find page 2 of the 2012 Entergy annual report below. You can navigate through the pages in the report by either clicking on the pages listed below, or by using the keyword search tool below to find specific information within the annual report.-
 1
1 -
 2
2 -
 3
3 -
 4
4 -
 5
5 -
 6
6 -
 7
7 -
 8
8 -
 9
9 -
 10
10 -
 11
11 -
 12
12 -
 13
13 -
14
-
15
-
16
-
17
-
18
-
19
-
20
-
21
-
22
-
23
-
24
-
25
-
26
-
27
-
28
-
29
-
30
-
31
-
32
-
33
-
34
-
35
-
36
-
37
-
38
-
39
-
40
-
41
-
42
-
43
-
44
-
45
-
46
-
47
-
48
-
49
-
50
-
51
-
52
-
53
-
54
-
55
-
56
-
57
-
58
-
59
-
60
-
61
-
62
-
63
-
64
-
65
-
66
-
67
-
68
-
69
-
70
-
71
-
72
-
73
-
74
-
75
-
76
-
77
-
78
-
79
-
80
-
81
-
82
-
83
-
84
-
85
-
86
-
87
-
88
-
89
-
90
-
91
-
92
-
93
-
94
-
95
-
96
-
97
-
98
-
99
-
100
-
101
-
102
-
103
-
104
-
105
-
106
-
107
-
108
-
109
-
110
-
111
-
112
 |
 |

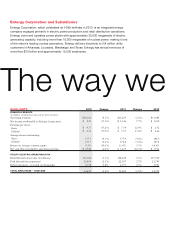
Entergy Corporation and Subsidiaries
Entergy Corporation, which celebrates its 100th birthday in 2013, is an integrated energy
company engaged primarily in electric power production and retail distribution operations.
Entergy owns and operates power plants with approximately 30,000 megawatts of electric
generating capacity, including more than 10,000 megawatts of nuclear power, making it one
of the nation’s leading nuclear generators. Entergy delivers electricity to 2.8 million utility
customers in Arkansas, Louisiana, Mississippi and Texas. Entergy has annual revenues of
more than $10 billion and approximately 15,000 employees.
The way we
HIGHLIGHTS 2012 Change 2011 Change 2010
FINANCIAL RESULTS
(in millions, except percentages and per share amounts)
Operating revenues $10,302 (8.3%) $11,229 (2.3%) $11,488
Net income attributable to Entergy Corporation $ 847 (37.1%) $ 1,346 7.7% $ 1,250
Earnings per share:
Basic
Diluted
$ 4.77
$ 4.76
(37.2%)
(37.0%)
$ 7.59
$ 7.55
12.9%
13.4%
$ 6.72
$ 6.66
Average shares outstanding:
Basic
Diluted
177.3
177.7
(0.1%)
(0.4%)
177.4
178.4
(4.6%)
(5.0%)
186.0
187.8
Return on average common equity 9.3% (39.6%) 15.4% 5.5% 14.6%
Net cash flow provided by operating activities $ 2,940 (6.0%) $ 3,129 (20.3%) $ 3,926
UTILITY ELECTRIC OPERATING DATA
Retail kilowatt-hour sales (in millions) 107,004 (1.5%) 108,688 1.1% 107,510
Peak demand (in megawatts) 21,866 (2.3%) 22,387 2.7% 21,799
Retail customers – year-end (in thousands) 2,778 0.8% 2,757 0.5% 2,743
TOTAL EMPLOYEES – YEAR-END 14,625 (0.4%) 14,682 (1.8%) 14,958