Entergy 2012 Annual Report Download - page 95
Download and view the complete annual report
Please find page 95 of the 2012 Entergy annual report below. You can navigate through the pages in the report by either clicking on the pages listed below, or by using the keyword search tool below to find specific information within the annual report.-
 1
1 -
2
-
3
-
4
-
5
-
6
-
7
-
8
-
9
-
10
-
11
-
12
-
13
-
14
-
15
-
16
-
17
-
18
-
19
-
20
-
21
-
22
-
23
-
24
-
25
-
26
-
27
-
28
-
29
-
30
-
31
-
32
-
33
-
34
-
35
-
36
-
37
-
38
-
39
-
40
-
41
-
42
-
43
-
44
-
45
-
46
-
47
-
48
-
49
-
50
-
51
-
52
-
53
-
54
-
55
-
56
-
57
-
58
-
59
-
60
-
61
-
62
-
63
-
64
-
65
-
66
-
67
-
68
-
69
-
70
-
71
-
72
-
73
-
74
-
75
-
76
-
77
-
78
-
79
-
80
-
81
-
82
-
83
-
84
-
 85
85 -
 86
86 -
 87
87 -
 88
88 -
 89
89 -
 90
90 -
 91
91 -
 92
92 -
 93
93 -
 94
94 -
 95
95 -
 96
96 -
 97
97 -
 98
98 -
 99
99 -
 100
100 -
 101
101 -
 102
102 -
 103
103 -
 104
104 -
 105
105 -
106
-
107
-
108
-
109
-
110
-
111
-
112
 |
 |

Entergy Corporation and Subsidiaries 2012
NOTES TO CONSOLIDATED FINANCIAL STATEMENTS continued
(e) The registered investment company holds investments in domestic and interna-
tional bond markets and estimates fair value using net asset value per share.
(f) The other remaining assets are U.S. municipal and foreign government bonds
stated at fair value as determined by broker quotes.
(g) The unallocated insurance contract investments are recorded at contract value,
which approximates fair value. The contract value represents contributions
made under the contract, plus interest, less funds used to pay benefits and
contract expenses, and less distributions to the master trust.
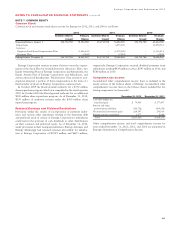
Accumulated Pension Benefit Obligation
The accumulated benefit obligation for Entergy’s qualified pension
plans was $5.4 billion and $4.6 billion at December 31, 2012 and
2011, respectively.
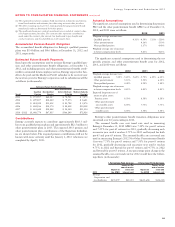
Estimated Future Benefit Payments
Based upon the assumptions used to measure Entergy’s qualified pen-
sion and other postretirement benefit obligations at December 31,
2012, and including pension and other postretirement benefits attrib-
utable to estimated future employee service, Entergy expects that ben-
efits to be paid and the Medicare Part D subsidies to be received over
the next ten years for Entergy Corporation and its subsidiaries will be
as follows (in thousands):
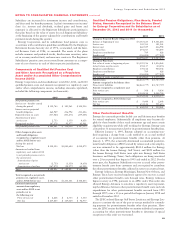
Estimated Future Benefits Payments
Other Postretirement Estimated Future
Qualified Non-Qualified (before Medicare Medicare Subsidy
Year(s) Pension Pension Subsidy) Receipts
2013 $ 195,907 $62,087 $ 74,981 $ 7,875
2014 $ 209,807 $12,440 $ 79,073 $ 8,641
2015 $ 224,922 $13,412 $ 83,788 $ 9,476
2016 $ 242,186 $10,174 $ 88,458 $10,358
2017 $ 261,448 $12,248 $ 94,340 $11,314
2018 - 2022 $1,648,774 $67,055 $566,249 $72,926
Contributions
Entergy currently expects to contribute approximately $163.3 mil-
lion to its qualified pension plans and approximately $82.5 million to
other postretirement plans in 2013. The expected 2013 pension and
other postretirement plan contributions of the Registrant Subsidiar-
ies are shown below. The required pension contributions will not be
known with more certainty until the January 1, 2013 valuations are
completed by April 1, 2013.
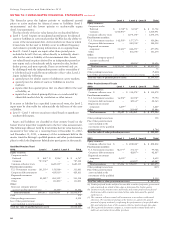
Actuarial Assumptions
The significant actuarial assumptions used in determining the pension
PBO and the other postretirement benefit APBO as of December 31,
2012, and 2011 were as follows:
2012 2011
Weighted-average discount rate:
Qualified pension 4.31% - 4.50% 5.10% - 5.20%
Other postretirement 4.36% 5.10%
Non-qualified pension 3.37% 4.40%
Weighted-average rate of increase
in future compensation levels 4.23% 4.23%
The significant actuarial assumptions used in determining the net
periodic pension and other postretirement benefit costs for 2012,
2011, and 2010 were as follows:
2012 2011 2010
Weighted-average discount rate:
Qualified pension 5.10% - 5.20% 5.60% - 5.70% 6.10% - 6.30%
Other postretirement 5.10% 5.50% 6.10%
Non-qualified pension 4.40% 4.90% 5.40%
Weighted-average rate of increase
in future compensation levels 4.23% 4.23% 4.23%
Expected long-term rate of
return on plan assets:
Pension assets 8.50% 8.50% 8.50%
Other postretirement
non-taxable assets 8.50% 7.75% 7.75%
Other postretirement
taxable assets 6.50% 5.50% 5.50%
Entergy’s other postretirement benefit transition obligations were
amortized over 20 years ending in 2012.
The assumed health care cost trend rate used in measuring
Entergy’s December 31, 2012 APBO was 7.50% for pre-65 retirees
and 7.25% for post-65 retirees for 2013, gradually decreasing each
successive year until it reaches 4.75% in 2022 and beyond for both
pre-65 and post-65 retirees. The assumed health care cost trend rate
used in measuring Entergy’s 2012 Net Other Postretirement Benefit
Cost was 7.75% for pre-65 retirees and 7.50% for post-65 retirees
for 2012, gradually decreasing each successive year until it reaches
4.75% in 2022 and beyond for pre-65 retirees and 4.75% in 2022
and beyond for post-65 retirees. A one percentage point change in the
assumed health care cost trend rate for 2012 would have the follow-
ing effects (in thousands):
1 Percentage Point Increase 1 Percentage Point Decrease
Impact on the Impact on the
sum of service sum of service
Impact on costs and Impact on costs and
2012 the APBO interest cost the APBO interest cost
Entergy
Corporation and
its subsidiaries $274,059 $28,455 $(220,654) $(22,210)
93