Entergy 2012 Annual Report Download - page 54
Download and view the complete annual report
Please find page 54 of the 2012 Entergy annual report below. You can navigate through the pages in the report by either clicking on the pages listed below, or by using the keyword search tool below to find specific information within the annual report.-
 1
1 -
2
-
3
-
4
-
5
-
6
-
7
-
8
-
9
-
10
-
11
-
12
-
13
-
14
-
15
-
16
-
17
-
18
-
19
-
20
-
21
-
22
-
23
-
24
-
25
-
26
-
27
-
28
-
29
-
30
-
31
-
32
-
33
-
34
-
35
-
36
-
37
-
38
-
39
-
40
-
41
-
42
-
43
-
 44
44 -
 45
45 -
 46
46 -
 47
47 -
 48
48 -
 49
49 -
 50
50 -
 51
51 -
 52
52 -
 53
53 -
 54
54 -
 55
55 -
 56
56 -
 57
57 -
 58
58 -
 59
59 -
 60
60 -
 61
61 -
 62
62 -
 63
63 -
 64
64 -
65
-
66
-
67
-
68
-
69
-
70
-
71
-
72
-
73
-
74
-
75
-
76
-
77
-
78
-
79
-
80
-
81
-
82
-
83
-
84
-
85
-
86
-
87
-
88
-
89
-
90
-
91
-
92
-
93
-
94
-
95
-
96
-
97
-
98
-
99
-
100
-
101
-
102
-
103
-
104
-
105
-
106
-
107
-
108
-
109
-
110
-
111
-
112
 |
 |

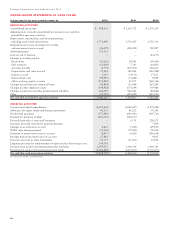
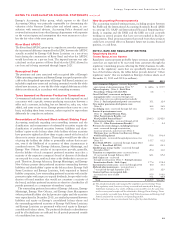
Entergy Corporation and Subsidiaries 2012
In thousands, as of December 31, 2012 2011
ASSETS
CURRENT ASSETS
Cash and cash equivalents:
Cash $ 112,992 $ 81,468
Temporary cash investments 419,577 612,970
Total cash and cash equivalents 532,569 694,438
Securitization recovery trust account 46,040 50,304
Accounts receivable:
Customer 568,871 568,558
Allowance for doubtful accounts (31,956) (31,159)
Other 161,408 166,186
Accrued unbilled revenues 303,392 298,283
Total accounts receivable 1,001,715 1,001,868
Deferred fuel costs 150,363 209,776
Accumulated deferred income taxes 306,902 9,856
Fuel inventory - at average cost 213,831 202,132
Materials and supplies - at average cost 928,530 894,756
Deferred nuclear refueling outage costs 243,374 231,031
System agreement cost equalization 16,880 36,800
Prepayments and other 242,922 291,742
Total 3,683,126 3,622,703
OTHER PROPERTY AND INVESTMENTS
Investment in affiliates - at equity 46,738 44,876
Decommissioning trust funds 4,190,108 3,788,031
Non-utility property - at cost (less accumulated depreciation) 256,039 260,436
Other 436,234 416,423
Total 4,929,119 4,509,766
PROPERTY, PLANT AND EQUIPMENT
Electric 41,944,567 39,385,524
Property under capital lease 935,199 809,449
Natural gas 353,492 343,550
Construction work in progress 1,365,699 1,779,723
Nuclear fuel 1,598,430 1,546,167
Total property, plant and equipment 46,197,387 43,864,413
Less - accumulated depreciation and amortization 18,898,842 18,255,128
Property, plant and equipment - net 27,298,545 25,609,285
DEFERRED DEBITS AND OTHER ASSETS
Regulatory assets:
Regulatory asset for income taxes - net 742,030 799,006
Other regulatory assets (includes securitization property of
$914,751 as of December 31, 2012 and $1,009,103 as of December 31, 2011) 5,025,912 4,636,871
Deferred fuel costs 172,202 172,202
Goodwill 377,172 377,172
Accumulated deferred income taxes 37,748 19,003
Other 936,648 955,691
Total 7,291,712 6,959,945
TOTAL ASSETS $43,202,502 $40,701,699
See Notes to Financial Statements.
CONSOLIDATED BALANCE SHEETS
52