Entergy 2012 Annual Report Download - page 48
Download and view the complete annual report
Please find page 48 of the 2012 Entergy annual report below. You can navigate through the pages in the report by either clicking on the pages listed below, or by using the keyword search tool below to find specific information within the annual report.-
 1
1 -
2
-
3
-
4
-
5
-
6
-
7
-
8
-
9
-
10
-
11
-
12
-
13
-
14
-
15
-
16
-
17
-
18
-
19
-
20
-
21
-
22
-
23
-
24
-
25
-
26
-
27
-
28
-
29
-
30
-
31
-
32
-
33
-
34
-
35
-
36
-
37
-
 38
38 -
 39
39 -
 40
40 -
 41
41 -
 42
42 -
 43
43 -
 44
44 -
 45
45 -
 46
46 -
 47
47 -
 48
48 -
 49
49 -
 50
50 -
 51
51 -
 52
52 -
 53
53 -
 54
54 -
 55
55 -
 56
56 -
 57
57 -
 58
58 -
59
-
60
-
61
-
62
-
63
-
64
-
65
-
66
-
67
-
68
-
69
-
70
-
71
-
72
-
73
-
74
-
75
-
76
-
77
-
78
-
79
-
80
-
81
-
82
-
83
-
84
-
85
-
86
-
87
-
88
-
89
-
90
-
91
-
92
-
93
-
94
-
95
-
96
-
97
-
98
-
99
-
100
-
101
-
102
-
103
-
104
-
105
-
106
-
107
-
108
-
109
-
110
-
111
-
112
 |
 |

Entergy Corporation and Subsidiaries 2012
payments. Based on recent market trends, the discount rates used
to calculate its 2012 qualified pension benefit obligation and 2013
qualified pension cost ranged from 4.31% to 4.50% for its specific
pension plans (4.36% combined rate for all pension plans). The dis-
count rates used to calculate its 2011 qualified pension benefit obliga-
tion and 2012 qualified pension cost ranged from 5.1% to 5.2% for
its specific pension plans (5.1% combined rate for all pension plans).
The discount rate used to calculate its other 2012 postretirement ben-
efit obligation and 2013 postretirement benefit cost was 4.36%. The
discount rate used to calculate its 2011 other postretirement benefit
obligation and 2012 postretirement benefit cost was 5.1%.
Entergy reviews actual recent cost trends and projected future
trends in establishing health care cost trend rates. Based on this
review, Entergy’s assumed health care cost trend rate assumption
used in measuring the December 31, 2012 accumulated postretire-
ment benefit obligation and 2013 postretirement cost was 7.50%
for pre-65 retirees and 7.25% for post-65 retirees for 2013, gradu-
ally decreasing each successive year until it reaches 4.75% in 2022
and beyond for both pre-65 and post-65 retirees. Entergy’s health
care cost trend rate assumption used in measuring the December
31, 2011 accumulated postretirement benefit obligation and 2012
postretirement cost was 7.75% for pre-65 retirees and 7.5% for
post-65 retirees for 2012, gradually decreasing each successive year
until it reaches 4.75% in 2022 and beyond for both pre-65 and post-
65 retirees.
The assumed rate of increase in future compensation levels used to
calculate 2012 and 2011 benefit obligations was 4.23%.
In determining its expected long-term rate of return on plan assets
used in the calculation of benefit plan costs, Entergy reviews past
performance, current and expected future asset allocations, and
capital market assumptions of its investment consultant and invest-
ment managers.
Since 2003, Entergy has targeted an asset allocation for its quali-
fied pension plan assets of roughly 65% equity securities and 35%
fixed-income securities. Entergy completed and adopted an optimiza-
tion study in 2011 for the pension assets which recommended that
the target asset allocation adjust dynamically over time, based on the
funded status of the plan, from its current to its ultimate allocation
of 45% equity, 55% fixed income. The ultimate asset allocation is
expected to be attained when the plan is 105% funded.
The current target allocations for Entergy’s non-taxable postretire-
ment benefit assets are 65% equity securities and 35% fixed-income
securities and, for its taxable other postretirement benefit assets, 65%
equity securities and 35% fixed-income securities. This takes into
account asset allocation adjustments that were made during 2012.
Entergy’s expected long term rate of return on qualified pension
assets used to calculate 2012, 2011 and 2010 qualified pension costs
was 8.5% and will be 8.5% for 2013. Entergy’s expected long term
rate of return on non-taxable other postretirement assets used to
calculate other postretirement costs was 8.5% for 2012 and 2011,
7.75% for 2010 and will be 8.5% for 2013. For Entergy’s taxable
postretirement assets, the expected long term rate of return was 6.5%
for 2012, 5.5% for 2011 and 2010, and will be 6.5% in 2013.
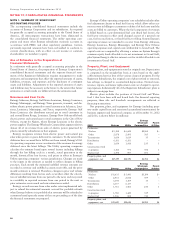
COST SENSITIVITY
The following chart reflects the sensitivity of qualified pension cost
and qualified pension projected benefit obligation to changes in
certain actuarial assumptions (dollars in thousands):
Impact on
Qualified
Impact on 2012 Projected
Change in Qualified Benefit
Actuarial Assumption Assumption Pension Cost Obligation
Increase/(Decrease)
Discount rate (0.25%) $20,142 $229,473
Rate of return on plan assets (0.25%) $ 9,337 $ –
Rate of increase in
compensation 0.25% $ 8,512 $ 48,036
The following chart reflects the sensitivity of postretirement benefit
cost and accumulated postretirement benefit obligation to changes in
certain actuarial assumptions (dollars in thousands):
Impact on
Accumulated
Impact on 2012 Postretirement
Change in Postretirement Benefit
Actuarial Assumption Assumption Benefit Cost Obligation
Increase/(Decrease)
Discount rate (0.25%) $ 8,061 $72,947
Health care cost trend 0.25% $11,422 $64,967
Each fluctuation above assumes that the other components of the
calculation are held constant.
ACCOUNTING MECHANISMS
Accounting standards require an employer to recognize in its
balance sheet the funded status of its benefit plans. Refer to Note
11 to the financial statements for a further discussion of Entergy’s
funded status.
In accordance with pension accounting standards, Entergy uti-
lizes a number of accounting mechanisms that reduce the volatility
of reported pension costs. Differences between actuarial assumptions
and actual plan results are deferred and are amortized into expense
only when the accumulated differences exceed 10% of the greater of
the projected benefit obligation or the market-related value of plan
assets. If necessary, the excess is amortized over the average remain-
ing service period of active employees.
Entergy calculates the expected return on pension and other post-
retirement benefit plan assets by multiplying the long-term expected
rate of return on assets by the market-related value (MRV) of plan
assets. Entergy determines the MRV of pension plan assets by cal-
culating a value that uses a 20-quarter phase-in of the difference
between actual and expected returns. For other postretirement benefit
plan assets Entergy uses fair value when determining MRV.
COSTS AND FUNDING
In 2012, Entergy’s total qualified pension cost was $264 million.
Entergy anticipates 2013 qualified pension cost to be $332 million.
Pension funding was approximately $170.5 million for 2012. Enter-
gy’s contributions to the pension trust are currently estimated to be
approximately $163.3 million in 2013, although the required pension
contributions will not be known with more certainty until the Janu-
ary 1, 2013 valuations are completed by April 1, 2013.
Minimum required funding calculations as determined under Pen-
sion Protection Act guidance are performed annually as of January 1
of each year and are based on measurements of the assets and fund-
ing liabilities as measured at that date. Any excess of the funding
liability over the calculated fair market value of assets results in a
funding shortfall which, under the Pension Protection Act, must be
funded over a seven-year rolling period. The Pension Protection Act
also imposes certain plan limitations if the funded percentage, which
MANAGEMENT’S FINANCIAL DISCUSSION AND ANALYSIS continued
46