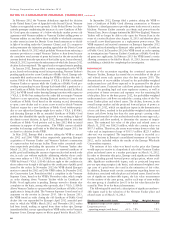
Entergy 2012 Annual Report Download - page 52
Download and view the complete annual report
Please find page 52 of the 2012 Entergy annual report below. You can navigate through the pages in the report by either clicking on the pages listed below, or by using the keyword search tool below to find specific information within the annual report.
Entergy Corporation and Subsidiaries 2012
In thousands, except share data, for the years ended December 31, 2012 2011 2010
OPERATING REVENUES
Electric $ 7,870,649 $ 8,673,517 $ 8,740,637
Natural gas 130,836 165,819 197,658
Competitive businesses 2,300,594 2,389,737 2,549,282
Total 10,302,079 11,229,073 11,487,577
OPERATING EXPENSES
Operating and maintenance:
Fuel, fuel-related expenses, and gas purchased for resale 2,036,835 2,492,714 2,518,582
Purchased power 1,255,800 1,564,967 1,659,416
Nuclear refueling outage expenses 245,600 255,618 256,123
Asset impairment 355,524 – –
Other operation and maintenance 3,045,392 2,867,758 2,969,402
Decommissioning 184,760 190,595 211,736
Taxes other than income taxes 557,298 536,026 534,299
Depreciation and amortization 1,144,585 1,102,202 1,069,894
Other regulatory charges - net 175,104 205,959 44,921
Total 9,000,898 9,215,839 9,264,373
Gain on sale of business – – 44,173
OPERATING INCOME 1,301,181 2,013,234 2,267,377
OTHER INCOME
Allowance for equity funds used during construction 92,759 84,305 59,381
Interest and investment income 127,776 128,994 184,077
Miscellaneous - net (53,214) (59,271) (48,124)
Total 167,321 154,028 195,334
INTEREST EXPENSE
Interest expense 606,596 551,521 610,146
Allowance for borrowed funds used during construction (37,312) (37,894) (34,979)
Total 569,284 513,627 575,167
INCOME BEFORE INCOME TAXES 899,218 1,653,635 1,887,544
Income taxes 30,855 286,263 617,239
CONSOLIDATED NET INCOME 868,363 1,367,372 1,270,305
Preferred dividend requirements of subsidiaries 21,690 20,933 20,063
NET INCOME ATTRIBUTABLE TO ENTERGY CORPORATION $ 846,673 $ 1,346,439 $1,250,242
Earnings per average common share:
Basic $4.77 $7.59 $6.72
Diluted $4.76 $7.55 $6.66
Dividends declared per common share $3.32 $3.32 $3.24
Basic average number of common shares outstanding 177,324,813 177,430,208 186,010,452
Diluted average number of common shares outstanding 177,737,565 178,370,695 187,814,235
See Notes to Financial Statements.
CONSOLIDATED STATEMENTS OF COMPREHENSIVE INCOME
In thousands, for the years ended December 31, 2012 2011 2010
NET INCOME $ 868,363 $1,367,372 $1,270,305
OTHER COMPREHENSIVE INCOME (LOSS)
Cash flow hedges net unrealized gain (loss)
(net of tax expense (benefit) of $(55,750), $34,411, and $(7,088)) (97,591) 71,239 (11,685)
Pension and other postretirement liabilities
(net of tax benefit of $61,223, $131,198, and $14,387) (91,157) (223,090) (8,527)
Net unrealized investment gains
(net of tax expense of $61,104, $19,368 and $51,130) 63,609 21,254 57,523
Foreign currency translation
(net of tax expense (benefit) of $275, $192, and $(182)) 508 357 (338)
Other comprehensive income (loss) (124,631) (130,240) 36,973
COMPREHENSIVE INCOME 743,732 1,237,132 1,307,278
Preferred dividend requirements of subsidiaries 21,690 20,933 20,063
COMPREHENSIVE INCOME ATTRIBUTABLE TO ENTERGY CORPORATION $ 722,042 $1,216,199 $1,287,215
See Notes to Financial Statements.
CONSOLIDATED INCOME STATEMENTS
50


