Entergy 2012 Annual Report Download - page 105
Download and view the complete annual report
Please find page 105 of the 2012 Entergy annual report below. You can navigate through the pages in the report by either clicking on the pages listed below, or by using the keyword search tool below to find specific information within the annual report.-
 1
1 -
2
-
3
-
4
-
5
-
6
-
7
-
8
-
9
-
10
-
11
-
12
-
13
-
14
-
15
-
16
-
17
-
18
-
19
-
20
-
21
-
22
-
23
-
24
-
25
-
26
-
27
-
28
-
29
-
30
-
31
-
32
-
33
-
34
-
35
-
36
-
37
-
38
-
39
-
40
-
41
-
42
-
43
-
44
-
45
-
46
-
47
-
48
-
49
-
50
-
51
-
52
-
53
-
54
-
55
-
56
-
57
-
58
-
59
-
60
-
61
-
62
-
63
-
64
-
65
-
66
-
67
-
68
-
69
-
70
-
71
-
72
-
73
-
74
-
75
-
76
-
77
-
78
-
79
-
80
-
81
-
82
-
83
-
84
-
85
-
86
-
87
-
88
-
89
-
90
-
91
-
92
-
93
-
94
-
 95
95 -
 96
96 -
 97
97 -
 98
98 -
 99
99 -
 100
100 -
 101
101 -
 102
102 -
 103
103 -
 104
104 -
 105
105 -
 106
106 -
 107
107 -
 108
108 -
 109
109 -
 110
110 -
 111
111 -
 112
112
 |
 |

Entergy Corporation and Subsidiaries 2012
NOTES TO CONSOLIDATED FINANCIAL STATEMENTS continued
corporate guarantees, which would require additional cash or letters
of credit in the event of a decrease in Entergy Corporation’s credit
rating to below investment grade.
On a daily basis, Entergy Wholesale Commodities calculates the
mark-to-market for all derivative transactions. Entergy Wholesale
Commodities Risk Control Group also validates forward market prices
by comparing them to settlement prices of actual market transactions.
Significant differences are analyzed and potentially adjusted based on
actual transaction clearing prices, or a methodology that considers
natural gas prices and market heat rates. Implied volatilities used to
value options are also validated using actual counterparty quotes for
Entergy Wholesale Commodities transactions. Moreover, on at least
a monthly basis the Office of Corporate Risk Oversight confirms
the mark-to-market calculations and prepares price scenarios
and credit downgrade scenario analysis. The scenario analysis is
communicated to senior management within Entergy and within
Entergy Wholesale Commodities. Finally, for all proposed derivative
transactions an analysis is completed to assess the risk of adding the
proposed derivative to Entergy Wholesale Commodities’ portfolio.
In particular, the credit, liquidity, and financial metrics impacts are
calculated for this analysis. This analysis is communicated to senior
management within Entergy and Entergy Wholesale Commodities.
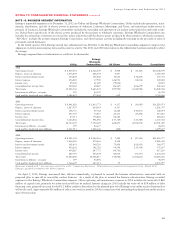
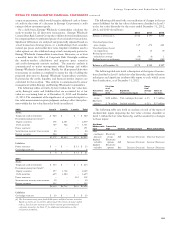
The following tables set forth, by level within the fair value hier-
archy, Entergy’s assets and liabilities that are accounted for at fair
value on a recurring basis as of December 31, 2012 and December
31, 2011. The assessment of the significance of a particular input to a
fair value measurement requires judgment and may affect their place-
ment within the fair value hierarchy levels (in millions):
2012 Level 1 Level 2 Level 3 Total
Assets:
Temporary cash investments $ 420 $ – $ – $ 420
Decommissioning trust funds(a):
Equity securities 358 2,101 – 2,459
Debt securities 769 962 – 1,731
Power contracts – – 191 191
Securitization recovery trust account 46 – – 46
Escrow accounts 386 – – 386
$1,979 $3,063 $191 $5,233
Liabilities:
Power contracts $ – $ – $ 13 $ 13
Gas hedge contracts 8 – – 8
$ 8 $ – $ 13 $ 21
2011
Assets:
Temporary cash investments $ 613 $ – $ – $ 613
Decommissioning trust funds(a):
Equity securities 397 1,732 – 2,129
Debt securities 639 1,020 – 1,659
Power contracts – – 312 312
Securitization recovery trust account 50 – – 50
Escrow accounts 335 – – 335
$2,034 $2,752 $312 $5,098
Liabilities:
Gas hedge contracts $ 30 $ – $ – $ 30
(a) The decommissioning trust funds hold equity and fixed income securities.
Equity securities are invested to approximate the returns of major market
indices. Fixed income securities are held in various governmental and
corporate securities. See Note 17 for additional information on the
investment portfolios.
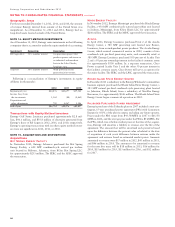
The following table sets forth a reconciliation of changes in the net
assets (liabilities) for the fair value of derivatives classified as Level 3
in the fair value hierarchy for the years ended December 31, 2012,
2011, and 2010 (in millions):
2012 2011 2010
Balance as of January 1, $ 312 $ 197 $ 200
Unrealized gains from
price changes 139 274 220
Unrealized gains (losses)
on originations 9 15 (4)
Realized gains (losses)
included in earnings (14) (6) 1
Realized gains on settlements (268) (168) (220)
Balance as of December 31, $ 178 $ 312 $ 197
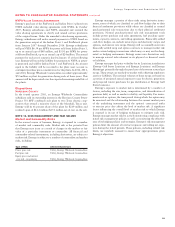
The following table sets forth a description of the types of transac-
tions classified as Level 3 in the fair value hierarchy, and the valuation
techniques and significant unobservable inputs to each which cause
that classification, as of December 31, 2012:
Fair Value Range
as of from
Transaction Dec. 31, Significant Average Effect on
Type 2012 Unobservable Inputs % Fair Value
Electricity
swaps $104 million Unit contingent discount +/-3% $ 5 million
Electricity
options $ 74 million Implied volatility +/-21% $37 million
The following table sets forth an analysis of each of the types of
unobservable inputs impacting the fair value of items classified as
Level 3 within the fair value hierarchy, and the sensitivity to changes
to those inputs:
Significant
Unobservable Transaction
Input Type Position Changes to Input Effect on Fair Value
Unit
contingent Electricity
discount swaps Sell Increase (Decrease) Decrease (Increase)
Implied Electricity
volatility options Sell Increase (Decrease) Increase (Decrease)
Implied Electricity
volatility options Buy Increase (Decrease) Increase (Decrease)
103