Entergy 2012 Annual Report Download - page 44
Download and view the complete annual report
Please find page 44 of the 2012 Entergy annual report below. You can navigate through the pages in the report by either clicking on the pages listed below, or by using the keyword search tool below to find specific information within the annual report.-
 1
1 -
2
-
3
-
4
-
5
-
6
-
7
-
8
-
9
-
10
-
11
-
12
-
13
-
14
-
15
-
16
-
17
-
18
-
19
-
20
-
21
-
22
-
23
-
24
-
25
-
26
-
27
-
28
-
29
-
30
-
31
-
32
-
33
-
 34
34 -
 35
35 -
 36
36 -
 37
37 -
 38
38 -
 39
39 -
 40
40 -
 41
41 -
 42
42 -
 43
43 -
 44
44 -
 45
45 -
 46
46 -
 47
47 -
 48
48 -
 49
49 -
 50
50 -
 51
51 -
 52
52 -
 53
53 -
 54
54 -
55
-
56
-
57
-
58
-
59
-
60
-
61
-
62
-
63
-
64
-
65
-
66
-
67
-
68
-
69
-
70
-
71
-
72
-
73
-
74
-
75
-
76
-
77
-
78
-
79
-
80
-
81
-
82
-
83
-
84
-
85
-
86
-
87
-
88
-
89
-
90
-
91
-
92
-
93
-
94
-
95
-
96
-
97
-
98
-
99
-
100
-
101
-
102
-
103
-
104
-
105
-
106
-
107
-
108
-
109
-
110
-
111
-
112
 |
 |

Entergy Corporation and Subsidiaries 2012
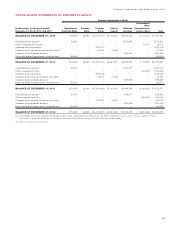
MANAGEMENT’S FINANCIAL DISCUSSION AND ANALYSIS continued
Commodity Price Risk
POWER GENERATION
As a wholesale generator, Entergy Wholesale Commodities core busi-
ness is selling energy, measured in MWh, to its customers. Entergy
Wholesale Commodities enters into forward contracts with its cus-
tomers and sells energy in the day ahead or spot markets. In addi-
tion to selling the energy produced by its plants, Entergy Wholesale
Commodities sells unforced capacity, which allows load-serving enti-
ties to meet specified reserve and related requirements placed on them
by the ISOs in their respective areas. Entergy Wholesale Commodities’
forward physical power contracts consist of contracts to sell energy
only, contracts to sell capacity only, and bundled contracts in which
it sells both capacity and energy. While the terminology and payment
mechanics vary in these contracts, each of these types of contracts
requires Entergy Wholesale Commodities to deliver MWh of energy,
make capacity available, or both. In addition to its forward physical
power contracts, Entergy Wholesale Commodities also uses a combi-
nation of financial contracts, including swaps, collars, put and/or call
options, to manage forward commodity price risk. Certain hedge vol-
umes have price downside and upside relative to market price move-
ment. The contracted minimum, expected value, and sensitivity are
provided to show potential variations. While the sensitivity reflects
the minimum, it does not reflect the total maximum upside potential
from higher market prices. The information contained in the table
below represents projections at a point in time and will vary over
time based on numerous factors, such as future market prices, con-
tracting activities, and generation. Following is a summary of Entergy
Wholesale Commodities’ current forward capacity and generation
contracts as well as total revenue projections based on market prices
as of December 31, 2012.
Entergy Wholesale Commodities Nuclear Portfolio
2013 2014 2015 2016 2017
Energy
Percent of planned
generation under contract(a):
Unit-contingent(b) 42% 22% 12% 12% 13%
Unit-contingent with
availability guarantees(c) 19% 15% 13% 13% 13%
Firm LD(d) 24% 55% 14% –% –%
Offsetting positions(e) –% (19%) –% –% –%
Total 85% 73% 39% 25% 26%
Planned generation (TWh)(f)(g) 40 41 41 40 41
Average revenue per MWh on
contracted volumes:
Minimum $45 $44 $45 $50 $51
Expected based on market prices
as of December 31, 2012 $46 $45 $47 $51 $52
Sensitivity: -/+ $10 per MWh
market price change $45-$48 $44-$48 $45-$52 $50-$53 $51-$54
Capacity
Percent of capacity sold forward(h):
Bundled capacity and
energy contracts(i) 16% 16% 16% 16% 16%
Capacity contracts(j) 33% 13% 12% 5% –%
Total 49% 29% 28% 21% 16%
Planned net MW in operation(g)(k) 5,011 5,011 5,011 5,011 5,011
Average revenue under contract
per kW per month
(applies to Capacity contracts only) $2.3 $2.9 $3.3 $3.4 $ –
Total Nuclear Energy and Capacity Revenues
Expected sold and market total
revenue per MWh $48 $45 $45 $47 $48
Sensitivity: -/+ $10 per MWh
market price change $47-$51 $42-$50 $38-$52 $40-$55 $41-$56
Entergy Wholesale Commodities Non-Nuclear Portfolio
2013 2014 2015 2016 2017
Energy
Percent of planned generation
under contract(a):
Cost-based contracts(l) 39% 32% 35% 32% 32%
Firm LD(d) 6% 6% 6% 6% 6%
Total 45% 38% 41% 38% 38%
Planned generation (TWh)(f)(m) 6 6 6 6 6
Capacity
Percent of capacity sold forward(h):
Cost-based contracts(l) 29% 24% 24% 24% 26%
Bundled capacity and
energy contracts(i) 8% 8% 8% 8% 9%
Capacity contracts(j) 48% 47% 48% 20% –%
Total 85% 79% 80% 52% 35%
Planned net MW in operation(k)(m) 1,052 1,052 1,052 1,052 977
(a) Percent of planned generation output sold or purchased forward under
contracts, forward physical contracts, forward financial contracts, or options
that mitigate price uncertainty that may require regulatory approval or
approval of transmission rights.
(b) Transaction under which power is supplied from a specific generation asset; if
the asset is not operating, seller is generally not liable to buyer for any damages.
(c) A sale of power on a unit-contingent basis coupled with a guarantee of avail-
ability provides for the payment to the power purchaser of contract damages,
if incurred, in the event the seller fails to deliver power as a result of the failure
of the specified generation unit to generate power at or above a specified avail-
ability threshold. All of Entergy’s outstanding guarantees of availability pro-
vide for dollar limits on Entergy’s maximum liability under such guarantees.
(d) Transaction that requires receipt or delivery of energy at a specified delivery
point (usually at a market hub not associated with a specific asset) or settles
financially on notional quantities; if a party fails to deliver or receive energy,
defaulting party must compensate the other party as specified in the contract, a
portion of which may be capped through the use of risk management products.
(e) Transactions for the purchase of energy, generally to offset a firm LD transaction.
(f) Amount of output expected to be generated by Entergy Wholesale
Commodities resources considering plant operating characteristics, outage
schedules, and expected market conditions that effect dispatch.
(g) Assumes NRC license renewal for plants whose current licenses expire within
five years and uninterrupted normal operation at all plants. NRC license
renewal applications are in process for two units, as follows (with current
license expirations in parentheses): Indian Point 2 (September 2013) and
Indian Point 3 (December 2015). For a discussion regarding the continued
operation of the Vermont Yankee plant, see “Impairment of Long-Lived
Assets” in Note 1 to the financial statements. For a discussion regarding the
license renewals for Indian Point 2 and Indian Point 3, see “Entergy Wholesale
Commodities Authorizations to Operate Its Nuclear Power Plants” above.
(h) Percent of planned qualified capacity sold to mitigate price uncertainty under
physical or financial transactions.
(i) A contract for the sale of installed capacity and related energy, priced per
megawatt-hour sold.
(j) A contract for the sale of an installed capacity product in a regional market.
(k) Amount of capacity to be available to generate power and/or sell capacity
considering uprates planned to be completed during the year.
(l) Contracts priced in accordance with cost-based rates, a ratemaking concept
used for the design and development of rate schedules to ensure that the filed
rate schedules recover only the cost of providing the service; these contracts are
on owned non-utility resources located within Entergy’s Utility service area,
which do not operate under market-based rate authority. The percentage sold
assumes approval of long-term transmission rights. Includes sales to the Utility
through 2013 of 121 MW of capacity and energy from Entergy Power sourced
from Independence Steam Electric Station Unit 2.
(m) Non-nuclear planned generation and net MW in operation include purchases
from affiliated and non-affiliated counterparties under long-term contracts
and exclude energy and capacity from Entergy Wholesale Commodities’ wind
investment and from the 544 MW Ritchie plant that is not planned to operate.
42