ComEd 2002 Annual Report Download - page 73
Download and view the complete annual report
Please find page 73 of the 2002 ComEd annual report below. You can navigate through the pages in the report by either clicking on the pages listed below, or by using the keyword search tool below to find specific information within the annual report.-
 1
1 -
2
-
3
-
4
-
5
-
6
-
7
-
8
-
9
-
10
-
11
-
12
-
13
-
14
-
15
-
16
-
17
-
18
-
19
-
20
-
21
-
22
-
23
-
24
-
25
-
26
-
27
-
28
-
29
-
30
-
31
-
32
-
33
-
34
-
35
-
36
-
37
-
38
-
39
-
40
-
41
-
42
-
43
-
44
-
45
-
46
-
47
-
48
-
49
-
50
-
51
-
52
-
53
-
54
-
55
-
56
-
57
-
58
-
59
-
60
-
61
-
62
-
 63
63 -
 64
64 -
 65
65 -
 66
66 -
 67
67 -
 68
68 -
 69
69 -
 70
70 -
 71
71 -
 72
72 -
 73
73 -
 74
74 -
 75
75 -
 76
76 -
 77
77 -
 78
78 -
 79
79 -
 80
80 -
 81
81 -
 82
82 -
 83
83 -
84
-
85
-
86
-
87
-
88
-
89
-
90
-
91
-
92
-
93
-
94
-
95
-
96
-
97
-
98
-
99
-
100
-
101
-
102
-
103
-
104
-
105
-
106
-
107
-
108
-
109
-
110
-
111
-
112
-
113
-
114
-
115
-
116
-
117
-
118
-
119
-
120
-
121
-
122
-
123
-
124
 |
 |

71
We use a Value-at-Risk (VaR) model to assess the market risk
associated with financial derivative instruments entered into
for proprietary trading purposes.The measured VaR represents
an estimate of the potential change in value of our proprietary
trading portfolio.
The VaR estimate includes a number of assumptions about
current market prices, estimates of volatility and correlations
between market factors.These estimates,however,are not nec-
essarily indicative of actual results, which may differ because
actual market rate fluctuations may differ from forecasted fluc-
tuations and because the portfolio may change over the hold-
ing period.
We estimate VaR using a model based on the Monte Carlo
simulation of commodity prices that captures the change in
value of forward purchases and sales as well as option values.
Parameters and values are backtested daily against daily
changes in mark-to-market value for proprietary trading activ-
ity. Value-at-Risk assumes that normal market conditions pre-
vail and that there are no changes in positions. We use a 95%
confidence interval,one-day holding period, one-tailed statisti-
cal measure in calculating our VaR. This means that we may
state that there is a one in 20 chance that if prices move against
our portfolio positions, our pre-tax loss in liquidating our port-
folio in a one-day holding period would exceed the calculated
VaR. To account for unusual events and loss of liquidity, we use
stress tests and scenario analysis.
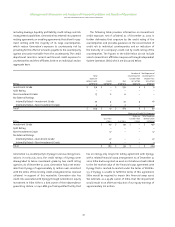
For financial reporting purposes only, we calculate several
other VaR estimates.The higher the confidence interval,the less
likely the chance that the VaR estimate would be exceeded. A
longer holding period considers the effect of liquidity in being
able to actually liquidate the portfolio.A two-tailed test consid-
ers potential upside in the portfolio in addition to the potential
downside in the portfolio considered in the one-tailed test.The
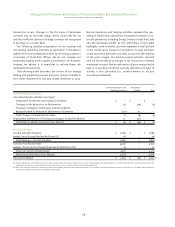
following table provides the VaR for all proprietary trading posi-
tions of Generation as of December 31, 2002.
Proprietary
Trading VaR
95% Confidence Level, One-Day Holding Period, One-Tailed
Period End $ 0.2
Average for the Period 1.4
High 5.0
Low 0.2
95% Confidence Level,Ten-Day Holding Period,Two-Tailed
Period End $ 0.3
Average for the Period 1.5
High 5.3
Low 0.1
99% Confidence Level, One-Day Holding Period,Two-Tailed
Period End $ 0.9
Average for the Period 4.6
High 16.7
Low 0.4
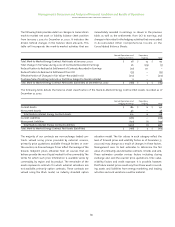
Credit Risk
Credit risk for Energy Delivery is managed by each of ComEd’s
and PECO’s credit and collection policies, which are consistent
with state regulatory requirements. ComEd and PECO are each
currently obligated to provide service to all electric customers
within their respective franchised territories.For the year ended
December 31, 2002, ComEd’s ten largest customers represented
approximately 3% of its retail electric revenues and PECO’s ten
largest customers represented approximately 8% of its retail
electric revenues. We record a provision for uncollectible
accounts, based upon historical experience and third-party
studies, to provide for the potential loss from nonpayment by
these customers.
Generation has credit risk associated with counterparty
performance on energy contracts which includes, but is not
limited to, the risk of financial default or slow payment.
Generation manages counterparty credit risk through estab-
lished policies,including counterparty credit limits,and in some
cases, requiring deposits and letters of credit to be posted by
certain counterparties. Generation’s counterparty credit limits
are based on a scoring model that considers a variety of factors,
Management’s Discussion and Analysis of Financial Condition and Results of Operations
exelon corporation and subsidiary companies