ComEd 2002 Annual Report Download - page 119
Download and view the complete annual report
Please find page 119 of the 2002 ComEd annual report below. You can navigate through the pages in the report by either clicking on the pages listed below, or by using the keyword search tool below to find specific information within the annual report.-
 1
1 -
2
-
3
-
4
-
5
-
6
-
7
-
8
-
9
-
10
-
11
-
12
-
13
-
14
-
15
-
16
-
17
-
18
-
19
-
20
-
21
-
22
-
23
-
24
-
25
-
26
-
27
-
28
-
29
-
30
-
31
-
32
-
33
-
34
-
35
-
36
-
37
-
38
-
39
-
40
-
41
-
42
-
43
-
44
-
45
-
46
-
47
-
48
-
49
-
50
-
51
-
52
-
53
-
54
-
55
-
56
-
57
-
58
-
59
-
60
-
61
-
62
-
63
-
64
-
65
-
66
-
67
-
68
-
69
-
70
-
71
-
72
-
73
-
74
-
75
-
76
-
77
-
78
-
79
-
80
-
81
-
82
-
83
-
84
-
85
-
86
-
87
-
88
-
89
-
90
-
91
-
92
-
93
-
94
-
95
-
96
-
97
-
98
-
99
-
100
-
101
-
102
-
103
-
104
-
105
-
106
-
107
-
108
-
 109
109 -
 110
110 -
 111
111 -
 112
112 -
 113
113 -
 114
114 -
 115
115 -
 116
116 -
 117
117 -
 118
118 -
 119
119 -
 120
120 -
 121
121 -
 122
122 -
 123
123 -
 124
124
 |
 |

Notes To Consolidated Financial Statements
exelon corporation and subsidiary companies
117
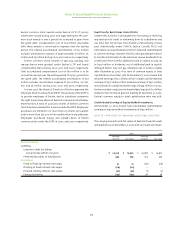
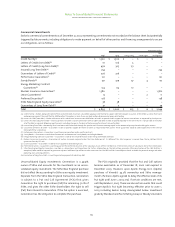
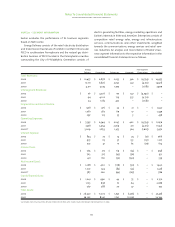
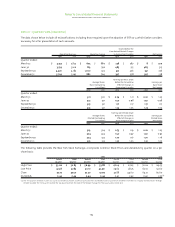
note 20 • segment information
Exelon evaluates the performance of its business segments
based on Net Income.
Energy Delivery consists of the retail electricity distribution
and transmission businesses of ComEd in northern Illinois and
PECO in southeastern Pennsylvania and the natural gas distri-
bution business of PECO located in the Pennsylvania counties
surrounding the City of Philadelphia. Generation consists of
electric generating facilities, energy marketing operations and
Exelon’s interests in Sithe and AmerGen. Enterprises consists of
competitive retail energy sales, energy and infrastructure
services, communications and other investments weighted
towards the communications, energy services and retail serv-
ices industries. An analysis and reconciliation of Exelon’s busi-
ness segment information to the respective information in the
consolidated financial statements are as follows:
Energy Intersegment
Delivery Generation Enterprises Corporate Eliminations Consolidated
Total Revenues:
2002 $ 10,457 $ 6,858 $ 2,033 $ 346 $ (4,739) $ 14,955
2001 10,171 6,826 2,292 341 (4,712) 14,918
2000 4,511 3,274 1,395 – (1,681) 7,499
Intersegment Revenues:
2002 $ 76 $ 4,226 $ 97 $ 341 $ (4,740) $ –
2001 94 4,102 179 337 (4,712) –
2000 24 1,185 472 – (1,681) –
Depreciation and Amortization:
2002 $ 978 $ 276 $ 55 $ 31 $ – $ 1,340
2001 1,081 282 69 17 – 1,449
2000 297 123 35 3 – 458
Operating Expenses:
2002 $ 7,597 $ 6,349 $ 2,047 $ 402 $ (4,739) $ 11,656
2001 7,578 5,954 2,369 371 (4,716) 11,556
2000(a) 3,009 2,833 1,473 324 (1,667) 5,972
Interest Expense:
2002 $ 854 $ 75 $ 14 $ 74 $ (51) $ 966
2001 973 115 37 133 (151) 1,107
2000 522 41 17 63 (29) 614
Income Taxes:
2002 $ 765 $ 217 $ 69 $ (53) $ – $ 998
2001 703 327 (43) (56) – 931
2000 421 160 (52) (190) – 339
Net Income/(Loss):
2002 $ 1,268 $ 400 $ (178) $ (50) $ – $ 1,440
2001 1,022 524 (85) (33) – 1,428
2000(a) 587 260 (94) (167) – 586
Capital Expenditures:
2002 $ 1,041 $ 990 $ 44 $ 75 $ – $ 2,150
2001 1,105 858 61 64 – 2,088
2000 367 288 70 27 – 752
Total Assets:
2002 $ 26,550 $ 11,007 $ 1,297 $ (1,376) $ – $ 37,478
2001 26,365 8,145 1,743 (1,509) – 34,744
(a) Includes non-recurring items of $276 million ($177 million after income taxes) for Merger-related expenses in 2000.