ComEd 2002 Annual Report Download - page 53
Download and view the complete annual report
Please find page 53 of the 2002 ComEd annual report below. You can navigate through the pages in the report by either clicking on the pages listed below, or by using the keyword search tool below to find specific information within the annual report.-
 1
1 -
2
-
3
-
4
-
5
-
6
-
7
-
8
-
9
-
10
-
11
-
12
-
13
-
14
-
15
-
16
-
17
-
18
-
19
-
20
-
21
-
22
-
23
-
24
-
25
-
26
-
27
-
28
-
29
-
30
-
31
-
32
-
33
-
34
-
35
-
36
-
37
-
38
-
39
-
40
-
41
-
42
-
 43
43 -
 44
44 -
 45
45 -
 46
46 -
 47
47 -
 48
48 -
 49
49 -
 50
50 -
 51
51 -
 52
52 -
 53
53 -
 54
54 -
 55
55 -
 56
56 -
 57
57 -
 58
58 -
 59
59 -
 60
60 -
 61
61 -
 62
62 -
 63
63 -
64
-
65
-
66
-
67
-
68
-
69
-
70
-
71
-
72
-
73
-
74
-
75
-
76
-
77
-
78
-
79
-
80
-
81
-
82
-
83
-
84
-
85
-
86
-
87
-
88
-
89
-
90
-
91
-
92
-
93
-
94
-
95
-
96
-
97
-
98
-
99
-
100
-
101
-
102
-
103
-
104
-
105
-
106
-
107
-
108
-
109
-
110
-
111
-
112
-
113
-
114
-
115
-
116
-
117
-
118
-
119
-
120
-
121
-
122
-
123
-
124
 |
 |

51
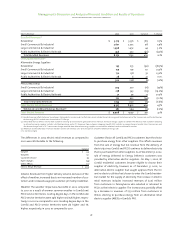
The changes in income (loss) before income taxes for 2001
compared to 2000, included the following:
– net realized gains on investments of $27 million,
– higher equity in earnings of unconsolidated affiliates of $23 mil-
lion from lower net losses in communications joint ventures,
– reduced losses of $21 million from sale of assets in 2000, and
– net write-downs on investments of $13 million.
The effective income tax rate was 33.6% for 2001 compared to
35.6% for 2000. This decrease in the effective tax rate was pri-
marily attributable to higher book write-downs of investments
in 2001, which were not deductible for income tax purposes.
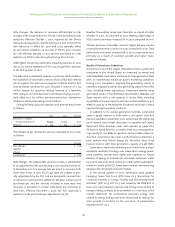
liquidity and capital resources
Our businesses are capital intensive and require considerable
capital resources.These capital resources are primarily provided
by internally generated cash flows from Energy Delivery’s and
Generation’s operations.When necessary,we obtain funds from
external sources in the capital markets and through bank bor-
rowings. Our access to external financing at reasonable terms
depends on our and our subsidiaries’credit ratings and general
business conditions, as well as that of the utility industry in
general. If these conditions deteriorate to where we no longer
have access to external financing sources at reasonable terms,
we have access to a $1.5 billion revolving credit facility which we
currently utilize to support our commercial paper program. See
the Credit Issues section of Liquidity and Capital Resources for
further discussion. We primarily use our capital resources to
fund our capital requirements, including construction, invest-
ments in new and existing ventures, to repay maturing debt
and to pay common stock dividends. Future acquisitions that
we may undertake may require external financing, which
might include our issuing common stock.
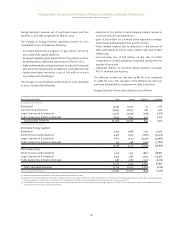
Cash Flows from Operating Activities
Cash flows provided by 2002 operations were consistent with
2001 at $3.6 billion. Energy Delivery and Generation provided
approximately 70% and 30%, respectively, of the 2002 cash
flows, while Enterprises’ contribution was not significant.
Energy Delivery’s cash flows from operating activities primarily
result from sales of electricity and gas to a stable and diverse
base of retail customers and are weighted toward the third
quarter. Energy Delivery’s future cash flows will depend upon
the ability to achieve operating cost reductions and the impact
of the economy, weather and customer choice on its revenues.
Generation’s cash flows from operating activities primarily
result from the sale of electric energy to wholesale customers,
including Energy Delivery and Enterprises. Generation’s future
cash flows from operating activities will depend upon future
demand and market prices for energy and the ability to con-
tinue to produce and supply power at competitive prices.
Although the amounts may vary from period to period as a
result of the uncertainties inherent in business, we expect that
Energy Delivery and Generation will continue to provide a reli-
able and steady source of internal cash flow from operations for
the foreseeable future. In the fourth quarter of 2002, we made
a discretionary tax-deductible pension plan contribution of
$150 million funded by ComEd, Generation and BSC. We also
expect to make a discretionary plan contribution in 2003 of
$300 million to $350 million.
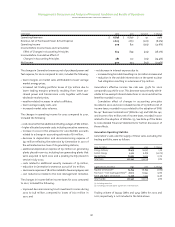
Cash Flows from Investing Activities
Cash flows used in investing activities for 2002 were $2.5 billion,
of which $2.2 billion was used for capital expenditures, com-
pared to $2.4 billion in 2001, of which $2.1 billion was used for
capital expenditures. Investing activities in 2002 also includes
$445 million for the acquisition of generating plants.
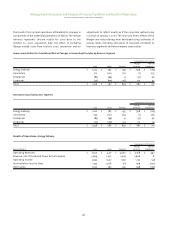
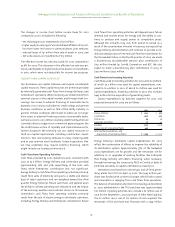
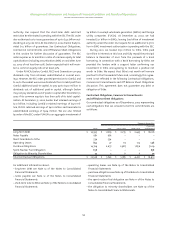
Capital expenditures by business segment for 2002 and
projected amounts for 2003 are as follows:
2002 2003
Energy Delivery $1,041 $ 989
Generation 990 963
Enterprises 44 26
Corporate and Other 75 32
Subtotal 2,150 2,010
Acquisition of Generating Plants 445 –
Total Capital Expenditures and
Acquisition of Generating Plants $ 2,595 $ 2,010
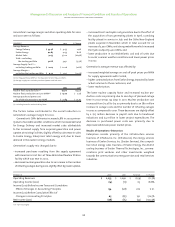
Energy Delivery’s estimated capital expenditures for 2003
reflect the continuation of efforts to improve the reliability of
its distribution system. Approximately 35% of the budgeted
2003 expenditures are for growth and the remainder are for
additions to or upgrades of existing facilities. We anticipate
that Energy Delivery will obtain financing, when necessary,
through borrowings, the issuance by PECO or ComEd,or both, of
preferred securities or capital contributions made by us.
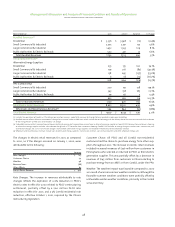
Generation purchased two natural-gas and oil-fired gener-
ating plants from TXU on April 25, 2002. The $443 million pur-
chase was funded with commercial paper, which Exelon issued
and Generation is repaying from cash flows from operations.
The balance of Generation short-term borrowings at December
31, 2002 attributable to the TXU purchase was approximately
$70 million. Investing activities also include a $2 million use of
cash for the November 1, 2002 purchase of Sithe New England.
The $2 million use is net of $12 million of cash acquired. The
remainder of the purchase was financed with a $534 million
Management’s Discussion and Analysis of Financial Condition and Results of Operations
exelon corporation and subsidiary companies