ComEd 2002 Annual Report Download - page 47
Download and view the complete annual report
Please find page 47 of the 2002 ComEd annual report below. You can navigate through the pages in the report by either clicking on the pages listed below, or by using the keyword search tool below to find specific information within the annual report.-
 1
1 -
2
-
3
-
4
-
5
-
6
-
7
-
8
-
9
-
10
-
11
-
12
-
13
-
14
-
15
-
16
-
17
-
18
-
19
-
20
-
21
-
22
-
23
-
24
-
25
-
26
-
27
-
28
-
29
-
30
-
31
-
32
-
33
-
34
-
35
-
36
-
 37
37 -
 38
38 -
 39
39 -
 40
40 -
 41
41 -
 42
42 -
 43
43 -
 44
44 -
 45
45 -
 46
46 -
 47
47 -
 48
48 -
 49
49 -
 50
50 -
 51
51 -
 52
52 -
 53
53 -
 54
54 -
 55
55 -
 56
56 -
 57
57 -
58
-
59
-
60
-
61
-
62
-
63
-
64
-
65
-
66
-
67
-
68
-
69
-
70
-
71
-
72
-
73
-
74
-
75
-
76
-
77
-
78
-
79
-
80
-
81
-
82
-
83
-
84
-
85
-
86
-
87
-
88
-
89
-
90
-
91
-
92
-
93
-
94
-
95
-
96
-
97
-
98
-
99
-
100
-
101
-
102
-
103
-
104
-
105
-
106
-
107
-
108
-
109
-
110
-
111
-
112
-
113
-
114
-
115
-
116
-
117
-
118
-
119
-
120
-
121
-
122
-
123
-
124
 |
 |

45
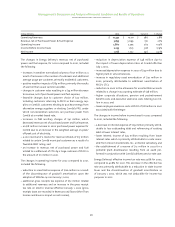
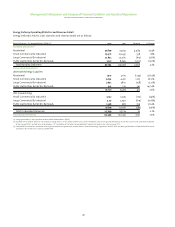
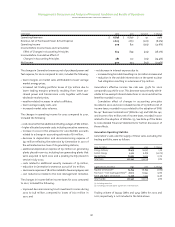
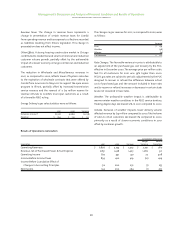
The changes in Enterprises’ operating income (loss) for 2002
compared to 2001, included the following:
– lower revenues of $65 million from Exelon Services as a result
of reduced construction projects offset by lower construction
costs of $51 million,
– reductions in administrative expenses of $28 million primarily
resulting from the Cost Management Initiative,
– reduction of amortization expense of $23 million as result of the
discontinuance of goodwill amortization upon the adoption of
SFAS No. 142 on January 1, 2002,
– accelerated depreciation of assets relating to Exelon Energy’s
discontinuance of retail sales in the PJM region of $7 million,
– higher gross margins at Exelon Energy of $28 million, which
reflect discontinuing retail sales in the PJM region and improved
gas and electricity margins.Energy revenue reductions of $170
million were more than offset by decreases in related cost of
$198 million, which included a favorable mark-to-market
adjustment of $16 million, and
– higher gross margins at InfraSource of $7 million consisting of:
– higher infrastructure and construction services revenues of
$97 million from an increase in the electric line of business
offset by higher infrastructure and construction costs of
$53 million, and
– lower revenues of $117 million as a result of the continued
decline of the telecommunications industry and related
reduction in construction services offset by lower construc-
tion costs of $80 million.
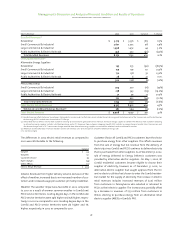
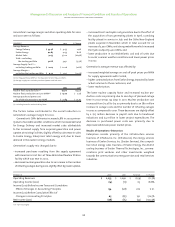
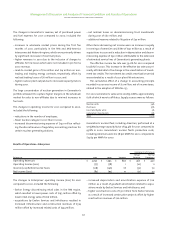
The changes in income (loss) before income taxes for 2002
compared to 2001, included the following:
– a pre-tax gain of $198 million recorded on the AT&T Wireless sale,
– lower interest expense of $23 million due to pay down of debt
from proceeds of the AT&T Wireless sale,
– higher equity in earnings of unconsolidated affiliates of $16
million resulting from the discontinuance of losses on AT&T
Wireless as a result of its sale,
– write-down of communications investments of $27 million,
energy related investment write-downs of $14 million, and a
net write-down of other assets of $4 million in 2002 offset by
$12 million loss from net write-downs of communications
investments, a $1 million loss from an energy related invest-
ment,and a net write-down of other assets of $2 million in 2001,
– equity in earnings from a communications joint venture of $9
million primarily relating to its recovery of trade receivables
previously considered uncollectible, and
– lower interest income of $7 million.
The effective income tax rate was 50.4% for 2002 compared to
33.3% for 2001.This increase in the effective tax rate was primar-
ily attributable to the AT&T Wireless sale and tax adjustments
resulting from various income tax related items of $21 million,
partially offset by the discontinuation of goodwill amortization
as of January 1, 2002, which was not deductible for income tax
purposes in 2001.
The cumulative effect of a change in accounting principle
recorded in 2002 due to the adoption of SFAS No. 142 reduced
net income by $243 million, net of income taxes. See Note 4 of
the Notes to Consolidated Financial Statements.
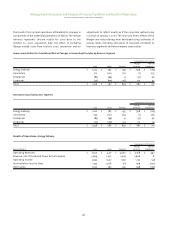
Year Ended December 31, 2001 Compared
To Year Ended December 31, 2000
On October 20, 2000, we became the parent corporation of
PECO and ComEd as a result of the Merger. Our results of oper-
ations for 2000 consist of PECO’s results for the entire year and
ComEd’s results from October 20, 2000 to the end of the year.
Net Income and Earnings Per Share
Our net income for 2001 increased $842 million, or 144%, com-
pared to 2000. Diluted earnings per share increased $1.56 per
share,or 54%.Income before the cumulative effect of changes in
accounting principles increased $854 million, or 152%, for 2001.
Diluted earnings per share on the same basis increased $1.64
per share, or 60%. Earnings per share increased less than net
income as a result of an increase in the weighted average
shares of common stock outstanding from the issuance of com-
mon stock in connection with the Merger,partially offset by the
repurchase of common stock with the proceeds from PECO’s
May 2000 stranded cost recovery securitization.
Results of Operations by Business Segment
The remaining sections under this heading, “Year Ended
December 31,2001 Compared To Year Ended December 31,2000,”
present the operating results for each of our business segments
for 2001.All comparisons presented under this heading are com-
parisons of operating results and other statistical information
for 2001 to operating results and other statistical information
for 2000. These results reflect intercompany transactions,
which are eliminated in our consolidated financial statements.
The October 20, 2000 acquisition of Unicom, and the
January 1, 2001 corporate restructuring, significantly impacted
our results of operations.To provide a more meaningful analy-
sis of results of operations, the business comparisons below
identify the portion of the variance that is attributable to
Unicom’s results of operations and the portion of the variance
Management’s Discussion and Analysis of Financial Condition and Results of Operations
exelon corporation and subsidiary companies