ComEd 2002 Annual Report Download - page 44
Download and view the complete annual report
Please find page 44 of the 2002 ComEd annual report below. You can navigate through the pages in the report by either clicking on the pages listed below, or by using the keyword search tool below to find specific information within the annual report.-
 1
1 -
2
-
3
-
4
-
5
-
6
-
7
-
8
-
9
-
10
-
11
-
12
-
13
-
14
-
15
-
16
-
17
-
18
-
19
-
20
-
21
-
22
-
23
-
24
-
25
-
26
-
27
-
28
-
29
-
30
-
31
-
32
-
33
-
 34
34 -
 35
35 -
 36
36 -
 37
37 -
 38
38 -
 39
39 -
 40
40 -
 41
41 -
 42
42 -
 43
43 -
 44
44 -
 45
45 -
 46
46 -
 47
47 -
 48
48 -
 49
49 -
 50
50 -
 51
51 -
 52
52 -
 53
53 -
 54
54 -
55
-
56
-
57
-
58
-
59
-
60
-
61
-
62
-
63
-
64
-
65
-
66
-
67
-
68
-
69
-
70
-
71
-
72
-
73
-
74
-
75
-
76
-
77
-
78
-
79
-
80
-
81
-
82
-
83
-
84
-
85
-
86
-
87
-
88
-
89
-
90
-
91
-
92
-
93
-
94
-
95
-
96
-
97
-
98
-
99
-
100
-
101
-
102
-
103
-
104
-
105
-
106
-
107
-
108
-
109
-
110
-
111
-
112
-
113
-
114
-
115
-
116
-
117
-
118
-
119
-
120
-
121
-
122
-
123
-
124
 |
 |

42
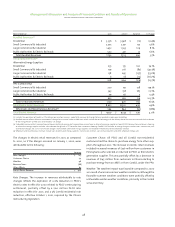
Rate Changes. The decrease in revenues attributable to rate
changes reflects $99 million for the 5% ComEd residential rate
reduction, effective October 1, 2001, required by the Illinois
restructuring legislation and the timing of a $60 million PECO
rate reduction in effect for 2001 and 2002, partially offset
by $50 million related to an increase in PECO’s gross receipts
tax rate effective January 1, 2002 and the expiration of a 6%
reduction in PECO’s rates during the first quarter of 2001.
Other Effects.The primary other item impacting revenues in 2002
was an $11 million settlement of CTCs by a large PECO customer
in the first quarter of 2001.
The reduction in wholesale revenue is primarily attributable to
the expiration of wholesale contracts that ComEd had entered
into to support the open access program in Illinois and the fact
that wholesale revenues for 2001 included a reversal of a $15
million reserve for customer refunds because of a favorable
FERC ruling in 2001.The decrease in wholesale revenue was par-
tially offset by a $12 million reimbursement from Generation
relating to third-party energy reconciliations.
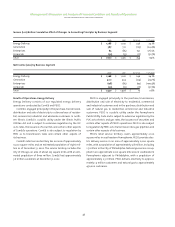
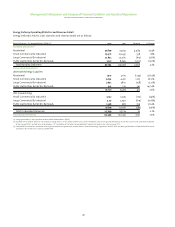
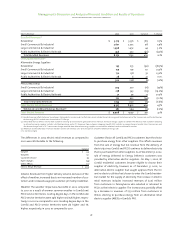
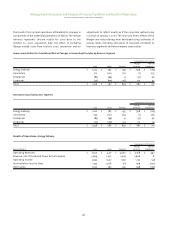
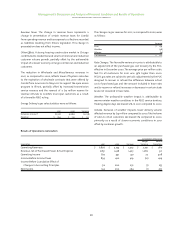
Energy Delivery’s gas sales statistics and revenue detail were
as follows:
2002 2001 Variance
Deliveries in millions
of cubic feet (mmcf) 85,545 81,528 4,017
Revenue $549 $ 654 $ (105)
The changes in gas revenue for 2002 as compared to 2001, were
as follows:
Variance
Rate Changes $ (108)
Weather 2
Volume 1
Gas Revenue $ (105)
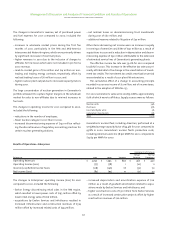
Rate Changes. The unfavorable variance in rates is attributable
to an adjustment of the purchased gas cost recovery by the PUC
in December 2001.The average rate per mmcf in 2002 was 20%
lower than it was in 2001. PECO’s gas rates are subject to peri-
odic adjustments by the PUC and are designed to recover from
or refund to customers the difference between actual cost of
purchased gas and the amount included in base rates and
increases or decreases in certain state taxes not recovered in
base rates. Effective December 1, 2002, the PUC approved a
reduction in the purchased gas adjustment of 4.5%.
Weather.The weather impact was favorable,as a result of colder
weather in 2002, as compared to 2001. Heating degree-days in
PECO’s service territory increased 1% in 2002 compared to 2001.
Volume. Exclusive of weather impacts, higher delivery volume
increased revenue by $1 million in 2002 compared to 2001.Total
deliveries to customers increased 5% in 2002 compared to 2001,
primarily as a result of customer growth and higher trans-
portation volumes.
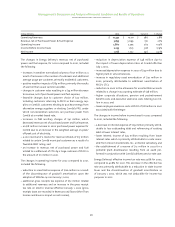
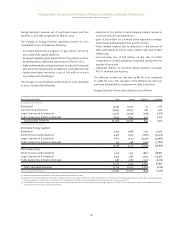
Results of Operations–Generation
Generation is one of the largest competitive electric generation
companies in the United States, as measured by owned and
controlled MWs. Generation combines its large generation fleet
with an experienced wholesale power marketing operation.
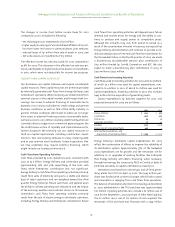
During 2002, Generation acquired the generating assets of
Sithe New England as well as two generating stations from TXU
Corp. Including those acquisitions, Generation directly owns
generation assets in the Northeast, Mid-Atlantic, Midwest and
Texas regions with a net capacity of 26,762 MWs including
14,547 MWs of nuclear capacity,and also controls another 13,900
MWs of capacity in the Midwest, Southeast and South Central
regions through long-term contracts.
In addition to its owned generation facilities, Generation
owns a 49.9% interest in Sithe with a call option, that first
became available in December 2002,to purchase the remaining
50.1% interest (see further discussion in Liquidity and Capital
Resources). Sithe develops, owns and operates 22 generation
facilities in North America. Currently, Sithe has a total generat-
ing capacity of 1,321 MWs in operation and 230 MWs under con-
struction. Generation also owns a 50% interest in AmerGen, a
joint venture with British Energy plc. AmerGen owns three
nuclear stations with total generation capacity of 2,481 MWs.
Generation’s wholesale marketing unit,Power Team,a major
wholesale marketer of energy, uses Generation’s energy gener-
ation portfolio, transmission rights and expertise to ensure
delivery of energy to Generation’s wholesale customers under
long-term and short-term contracts,including the load require-
ments of ComEd and PECO.Power Team markets any remaining
energy in the wholesale and spot markets.
In the second quarter of 2002, Generation early adopted
Emerging Issues Task Force (EITF) Issue 02-3 “Accounting for
Contracts Involved in Energy Trading and Risk Management
Activities” (EITF 02-3). EITF 02-3 was issued by the FASB EITF in
June 2002 and required revenues and energy costs related to
energy trading contracts to be presented on a net basis in the
income statement. For comparative purposes, energy costs
related to energy trading have been reclassified as revenue for
prior periods to conform to the net basis of presentation
required by EITF 02-3.
Management’s Discussion and Analysis of Financial Condition and Results of Operations
exelon corporation and subsidiary companies