ComEd 2002 Annual Report Download - page 108
Download and view the complete annual report
Please find page 108 of the 2002 ComEd annual report below. You can navigate through the pages in the report by either clicking on the pages listed below, or by using the keyword search tool below to find specific information within the annual report.-
 1
1 -
2
-
3
-
4
-
5
-
6
-
7
-
8
-
9
-
10
-
11
-
12
-
13
-
14
-
15
-
16
-
17
-
18
-
19
-
20
-
21
-
22
-
23
-
24
-
25
-
26
-
27
-
28
-
29
-
30
-
31
-
32
-
33
-
34
-
35
-
36
-
37
-
38
-
39
-
40
-
41
-
42
-
43
-
44
-
45
-
46
-
47
-
48
-
49
-
50
-
51
-
52
-
53
-
54
-
55
-
56
-
57
-
58
-
59
-
60
-
61
-
62
-
63
-
64
-
65
-
66
-
67
-
68
-
69
-
70
-
71
-
72
-
73
-
74
-
75
-
76
-
77
-
78
-
79
-
80
-
81
-
82
-
83
-
84
-
85
-
86
-
87
-
88
-
89
-
90
-
91
-
92
-
93
-
94
-
95
-
96
-
97
-
 98
98 -
 99
99 -
 100
100 -
 101
101 -
 102
102 -
 103
103 -
 104
104 -
 105
105 -
 106
106 -
 107
107 -
 108
108 -
 109
109 -
 110
110 -
 111
111 -
 112
112 -
 113
113 -
 114
114 -
 115
115 -
 116
116 -
 117
117 -
 118
118 -
119
-
120
-
121
-
122
-
123
-
124
 |
 |

Notes To Consolidated Financial Statements
exelon corporation and subsidiary companies
106
Weighted Weighted Weighted
Average Average Average
Exercise Exercise Exercise
Price Price Price
Shares (per share) Shares (per share) Shares (per share)
2002 2002 2001 2001 2000 2000
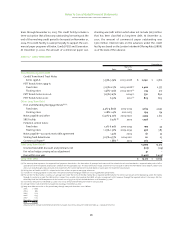
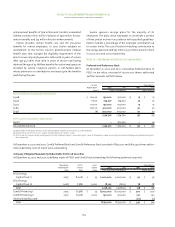
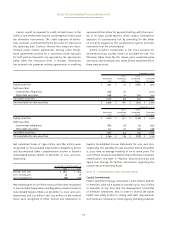
Balance at January 1 14,039,996 $ 43.96 15,287,859 $ 42.13 6,065,897 $ 31.91
Options granted/assumed 3,938,632 47.12 629,200 66.42 11,089,051(a) 46.09
Options exercised (1,821,339) 33.37 (1,695,474) 34.84 (1,725,058) 31.79
Options canceled (270,299) 53.62 (181,589) 52.64 (142,031) 39.95
Balance at December 31 15,886,990 45.80 14,039,996 43.96 15,287,859 42.13
Exercisable at December 31 10,491,184 43.96 8,006,193 38.75 4,953,942 30.04
Weighted average fair value
of options granted during year $ 13.62 $ 19.59 $ 16.62
(a) Includes 5.3 million options converted in the Merger.
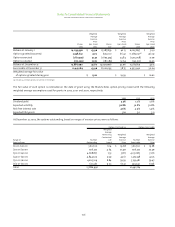
The fair value of each option is estimated on the date of grant using the Black-Scholes option-pricing model with the following
weighted average assumptions used for grants in 2002, 2001 and 2000,respectively:
2002 2001 2000
Dividend yield 3.3% 3.2% 3.6%
Expected volatility 36.8% 36.8% 36.8%
Risk-free interest rate 4.6% 4.9% 5.9%
Expected life (years) 5.0 5.0 5.0
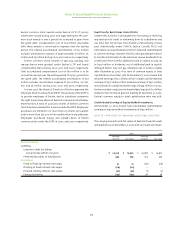
At December 31, 2002, the options outstanding, based on ranges of exercise prices,were as follows:
Options Outstanding Options Exercisable
Weighted
Average
Remaining Weighted Weighted
Contractual Average Average
Range of Number Life Exercise Number Exercise
Exercise Prices Outstanding (years) Price Exercisable Price
$10.01-$20.00 560,700 6.14 $ 19.68 560,700 $ 19.68
$20.01-$30.00 926,332 4.64 25.49 926,332 25.49
$30.01-$40.00 4,668,877 7.53 37.87 4,031,683 37.76
$40.01-$50.00 4,844,505 9.39 45.61 1,419,748 42.25
$50.01-$60.00 4,265,109 8.84 59.39 3,159,481 59.47
$60.01-$70.00 621,467 9.03 67.32 393,240 67.28
Total 15,886,990 10,491,184