ComEd 2002 Annual Report Download - page 48
Download and view the complete annual report
Please find page 48 of the 2002 ComEd annual report below. You can navigate through the pages in the report by either clicking on the pages listed below, or by using the keyword search tool below to find specific information within the annual report.-
 1
1 -
2
-
3
-
4
-
5
-
6
-
7
-
8
-
9
-
10
-
11
-
12
-
13
-
14
-
15
-
16
-
17
-
18
-
19
-
20
-
21
-
22
-
23
-
24
-
25
-
26
-
27
-
28
-
29
-
30
-
31
-
32
-
33
-
34
-
35
-
36
-
37
-
 38
38 -
 39
39 -
 40
40 -
 41
41 -
 42
42 -
 43
43 -
 44
44 -
 45
45 -
 46
46 -
 47
47 -
 48
48 -
 49
49 -
 50
50 -
 51
51 -
 52
52 -
 53
53 -
 54
54 -
 55
55 -
 56
56 -
 57
57 -
 58
58 -
59
-
60
-
61
-
62
-
63
-
64
-
65
-
66
-
67
-
68
-
69
-
70
-
71
-
72
-
73
-
74
-
75
-
76
-
77
-
78
-
79
-
80
-
81
-
82
-
83
-
84
-
85
-
86
-
87
-
88
-
89
-
90
-
91
-
92
-
93
-
94
-
95
-
96
-
97
-
98
-
99
-
100
-
101
-
102
-
103
-
104
-
105
-
106
-
107
-
108
-
109
-
110
-
111
-
112
-
113
-
114
-
115
-
116
-
117
-
118
-
119
-
120
-
121
-
122
-
123
-
124
 |
 |

46
that results from normal operations attributable to changes in
components of the underlying operations of Exelon.The merger
variance represents Unicom results for 2000 prior to the
October 20, 2000 acquisition date, the effect of excluding
Merger-related costs from Exelon’s 2000 operations and an
adjustment to reflect results as if the corporate restructuring
occurred on January 1, 2000.The 2000 pro forma effects of the
Merger and restructuring were developed using estimates of
various items, including allocations of corporate overheads to
business segments and intercompany transactions.
Management’s Discussion and Analysis of Financial Condition and Results of Operations
exelon corporation and subsidiary companies
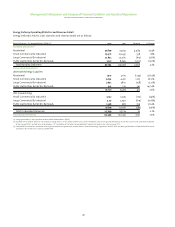
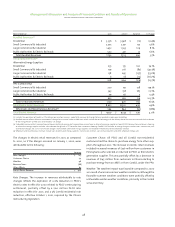
Income (Loss) Before the Cumulative Effect of Changes in Accounting Principles by Business Segment
Components of Variance
Merger Normal
2001 2000 Variance Variance Operations
Energy Delivery $ 1,022 $ 587 $ 435 $ 598 $ (163)
Generation 512 260 252 (1) 253
Enterprises (85) (94) 9 (31) 40
Corporate (33) (191) 158 115 43
Total $ 1,416 $ 562 $ 854 $ 681 $ 173
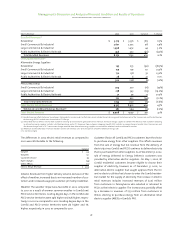
Net Income (Loss) by Business Segment
Components of Variance
Merger Normal
2001 2000 Variance Variance Operations
Energy Delivery $ 1,022 $ 587 $ 435 $ 598 $ (163)
Generation 524 260 264 (1) 265
Enterprises (85) (94) 9 (31) 40
Corporate (33) (167) 134 115 19
Total $ 1,428 $ 586 $ 842 $ 681 $ 161
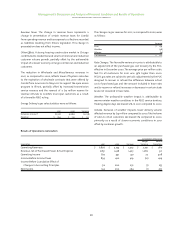
Results of Operations–Energy Delivery
Components of Variance
Merger Normal
Energy Delivery 2001 2000 Variance Variance Operations
Operating Revenues $ 10,171 $ 4,511 $ 5,660 $ 5,168 $ 492
Revenue, net of Purchased Power & Fuel Expense 5,699 2,725 2,974 2,966 8
Operating Income 2,593 1,502 1,091 1,132 (41)
Income Before Income Taxes 1,725 1,008 717 919 (202)
Net Income 1,022 587 435 598 (163)