ComEd 2002 Annual Report Download - page 52
Download and view the complete annual report
Please find page 52 of the 2002 ComEd annual report below. You can navigate through the pages in the report by either clicking on the pages listed below, or by using the keyword search tool below to find specific information within the annual report.-
 1
1 -
2
-
3
-
4
-
5
-
6
-
7
-
8
-
9
-
10
-
11
-
12
-
13
-
14
-
15
-
16
-
17
-
18
-
19
-
20
-
21
-
22
-
23
-
24
-
25
-
26
-
27
-
28
-
29
-
30
-
31
-
32
-
33
-
34
-
35
-
36
-
37
-
38
-
39
-
40
-
41
-
 42
42 -
 43
43 -
 44
44 -
 45
45 -
 46
46 -
 47
47 -
 48
48 -
 49
49 -
 50
50 -
 51
51 -
 52
52 -
 53
53 -
 54
54 -
 55
55 -
 56
56 -
 57
57 -
 58
58 -
 59
59 -
 60
60 -
 61
61 -
 62
62 -
63
-
64
-
65
-
66
-
67
-
68
-
69
-
70
-
71
-
72
-
73
-
74
-
75
-
76
-
77
-
78
-
79
-
80
-
81
-
82
-
83
-
84
-
85
-
86
-
87
-
88
-
89
-
90
-
91
-
92
-
93
-
94
-
95
-
96
-
97
-
98
-
99
-
100
-
101
-
102
-
103
-
104
-
105
-
106
-
107
-
108
-
109
-
110
-
111
-
112
-
113
-
114
-
115
-
116
-
117
-
118
-
119
-
120
-
121
-
122
-
123
-
124
 |
 |

50
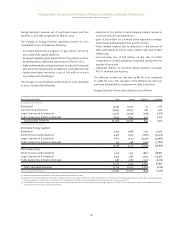
The changes in Generation's revenue, net of purchased power
and fuel expense, for 2001 compared to 2000, included the
following:
– increases in wholesale market prices during the first five
months of 2001, particularly in the PJM and Mid-America
Interconnected Network regions, which were primarily driven
by significant increases in fossil fuel prices,
– higher revenues in 2001 due to the inclusion of charges to
affiliates for line losses which were not included in pro forma
2000 revenue,
– mark-to-market gains of $16 million and $14 million on non-
trading and trading energy contracts, respectively, offset by
realized trading losses of $6 million in 2001, and
– higher nuclear plant output due to increased capacity factors
during 2001.
The large concentration of nuclear generation in Generation’s
portfolio allowed it to capture higher margins in the wholesale
market for sales to non-affiliates due to minimal increases in
fuel costs.
The changes in operating income for 2001 compared to 2000,
included the following:
– reductions in the number of employees,
– fewer nuclear outages in 2001 than in 2000,
– increased decommissioning expense of $140 million reflect-
ing the discontinuance of regulatory accounting practices for
certain nuclear generating stations,
– net realized losses on decommissioning trust investments
during 2001 of $60 million, and
– additional reserves related to litigation of $30 million.
Other items decreasing net income were an increase in equity
in earnings of AmerGen and Sithe of $90 million as a result of
acquisitions in 2000 and a reduction in depreciation and decom-
missioning expense of $90 million attributable to the extension
of estimated service lives of Generation’s generating plants.
The effective income tax rate was 39.0% for 2001 compared
to 38.1% for 2000.This increase in the effective tax rate was pri-
marily attributable to the change in the amortization of invest-
ment tax credits.The investment tax credit amortization period
was extended as a result of 2001 plant life extensions.
The cumulative effect of a change in accounting principle
recorded in 2001 was income of $12 million,net of income taxes,
related to the adoption of SFAS No.133.
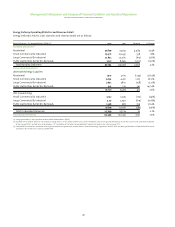
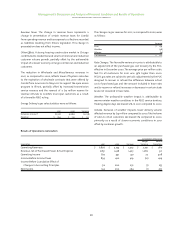
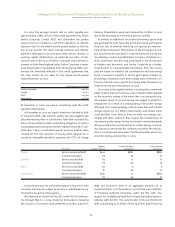
For 2001, Generation’s sales were 201,879 GWhs, approximately
60% of which were to affiliates.Supply sources were as follows:
Nuclear units 54%
Purchases 37%
Fossil and hydro units 3%
Generation investments 6%
Total 100%
Generation’s nuclear fleet, including AmerGen, performed at a
weighted average capacity factor of 94.4% for 2001 compared to
93.8% in 2000. Generation’s nuclear fleet’s production costs,
including AmerGen,were $12.78 per MWh for 2001,compared to
$14.64 per MWh for 2000.
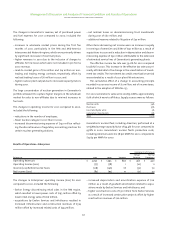
Management’s Discussion and Analysis of Financial Condition and Results of Operations
exelon corporation and subsidiary companies
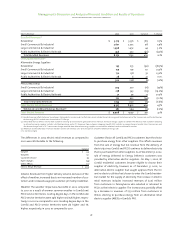
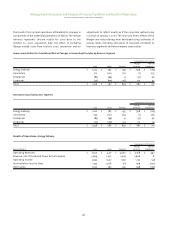
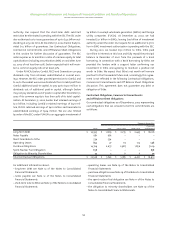
Results of Operations–Enterprises
Components of Variance
Merger Normal
Enterprises 2001 2000 Variance Variance Operations
Operating Revenues $ 2,292 $ 1,395 $ 897 $ 467 $ 430
Operating Income (Loss) (77) (78) 1 (10) 11
Income (Loss) Before Income Taxes (128) (146) 18 (52) 70
Net Income (Loss) (85) (94) 9 (31) 40
The changes in Enterprises’ operating income (loss) for 2001
compared to 2000, included the following:
– Exelon Energy discontinuing retail sales in the PJM region,
which resulted in lower power costs of $193 million offset by
lower retail energy sales of $166 million,
– acquisitions by Exelon Services and InfraSource resulted in
increased infrastructure and construction revenues of $574
million offset by increased related costs of $554 million,
– increased depreciation and amortization expense of $26
million as a result of goodwill amortization related to acqui-
sitions made by Exelon Services and InfraSource,and
– higher construction costs of $32 million from Exelon Services
as a result of increased construction projects offset by higher
construction revenues of $26 million.