Western Union 2015 Annual Report Download - page 70
Download and view the complete annual report
Please find page 70 of the 2015 Western Union annual report below. You can navigate through the pages in the report by either clicking on the pages listed below, or by using the keyword search tool below to find specific information within the annual report.-
 1
1 -
2
-
3
-
4
-
5
-
6
-
7
-
8
-
9
-
10
-
11
-
12
-
13
-
14
-
15
-
16
-
17
-
18
-
19
-
20
-
21
-
22
-
23
-
24
-
25
-
26
-
27
-
28
-
29
-
30
-
31
-
32
-
33
-
34
-
35
-
36
-
37
-
38
-
39
-
40
-
41
-
42
-
43
-
44
-
45
-
46
-
47
-
48
-
49
-
50
-
51
-
52
-
53
-
54
-
55
-
56
-
57
-
58
-
59
-
 60
60 -
 61
61 -
 62
62 -
 63
63 -
 64
64 -
 65
65 -
 66
66 -
 67
67 -
 68
68 -
 69
69 -
 70
70 -
 71
71 -
 72
72 -
 73
73 -
 74
74 -
 75
75 -
 76
76 -
 77
77 -
 78
78 -
 79
79 -
 80
80 -
81
-
82
-
83
-
84
-
85
-
86
-
87
-
88
-
89
-
90
-
91
-
92
-
93
-
94
-
95
-
96
-
97
-
98
-
99
-
100
-
101
-
102
-
103
-
104
-
105
-
106
-
107
-
108
-
109
-
110
-
111
-
112
-
113
-
114
-
115
-
116
-
117
-
118
-
119
-
120
-
121
-
122
-
123
-
124
-
125
-
126
-
127
-
128
-
129
-
130
-
131
-
132
-
133
-
134
-
135
-
136
-
137
-
138
-
139
-
140
-
141
-
142
-
143
-
144
-
145
-
146
-
147
-
148
-
149
-
150
-
151
-
152
-
153
-
154
-
155
-
156
-
157
-
158
-
159
-
160
-
161
-
162
-
163
-
164
-
165
-
166
-
167
-
168
-
169
-
170
-
171
-
172
-
173
-
174
-
175
-
176
-
177
-
178
-
179
-
180
-
181
-
182
-
183
-
184
-
185
-
186
-
187
-
188
-
189
-
190
-
191
-
192
-
193
-
194
-
195
-
196
-
197
-
198
-
199
-
200
-
201
-
202
-
203
-
204
-
205
-
206
-
207
-
208
-
209
-
210
-
211
-
212
-
213
-
214
-
215
-
216
-
217
-
218
-
219
-
220
-
221
-
222
-
223
-
224
-
225
-
226
-
227
-
228
-
229
-
230
-
231
-
232
-
233
-
234
-
235
-
236
-
237
-
238
-
239
-
240
-
241
-
242
-
243
-
244
-
245
-
246
-
247
-
248
-
249
-
250
-
251
-
252
-
253
-
254
-
255
-
256
-
257
-
258
-
259
-
260
-
261
-
262
-
263
-
264
-
265
-
266
 |
 |

NOTICE OF 2016 ANNUAL MEETING OF STOCKHOLDERS AND PROXY STATEMENT
52 | The Western Union Company
EXECUTIVE COMPENSATION
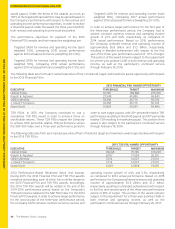
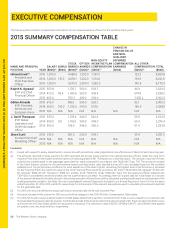
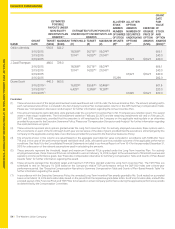
The following table contains compensation information for our named executive officers for the last three fiscal years.
2015 SUMMARY COMPENSATION TABLE
NAME AND PRINCIPAL
POSITION YEAR SALARY
($000)(1) BONUS
($000)
STOCK
AWARDS
($000)(2)
OPTION
AWARDS
($000)(2)
NON-EQUITY
INCENTIVE PLAN
COMPENSATION
($000)(3)
CHANGE IN
PENSION VALUE
AND NON-
QUALIFIED
DEFERRED
COMPENSATION
EARNINGS
($000)
ALL OTHER
COMPENSATION
($000)(4) TOTAL
($000)
Hikmet Ersek(5)
President and
Chief Executive
Officer
2015 1,000.0 —4,480.6 1,200.0 1,767.0 —122.2 8,569.8
2014 1,000.0 115.0 4,478.1 1,200.0 1,314.8 —133.9 8,241.8
2013 1,000.0 —4,375.0 2,000.0 1,260.0 —140.9 8,775.9
Rajesh K. Agrawal
EVP and Chief
Financial Officer
2015 563.8 —1,120.1 300.0 603.7 —46.9 2,634.5
2014 472.0 93.4 1,435.6 260.0 442.4 —674.8 3,378.2
2013 405.0 —972.3 429.0 324.0 —1,230.2 3,360.5
Odilon Almeida
EVP, President,
Americas and
European Union
2015 610.0 —896.1 240.0 652.1 —52.1 2,450.3
2014 600.0 193.2 1,312.6 240.0 507.6 —185.5 3,038.9
2013 N/A N/A N/A N/A N/A N/A N/A N/A
J. David Thompson
EVP, Global
Operations and
Chief Information
Officer
2015 533.3 —1,178.4 240.0 524.4 —55.9 2,532.0
2014 500.0 9.0 1,118.0 240.0 459.0 —50.4 2,376.4
2013 500.0 —916.5 396.0 360.0 —61.4 2,233.9
Diane Scott
Former EVP, Chief
Marketing Officer
2015 515.0 —821.5 220.0 504.1 —30.4 2,091.0
2014 N/A N/A N/A N/A N/A N/A N/A N/A
2013 N/A N/A N/A N/A N/A N/A N/A N/A
Footnotes:
(1) Except with respect to salary adjustments in connection with promotions, salary adjustments are effective as of March of each reporting year.
(2) The amounts reported in these columns for 2015 represent the annual equity grants to the named executive officers under the Long-Term
Incentive Plan and a time-based restricted stock unit award granted to Mr. Thompson as a retention grant. The amounts reported in these
columns are valued based on the aggregate grant date fair value computed in accordance with FASB ASC Topic 718. The amounts included
in the Stock Awards column for the performance-based restricted stock units granted during 2015 are calculated based on the probable
satisfaction of the performance conditions for such awards as of the date of grant. Assuming the highest level of performance is achieved
for the Financial PSUs, the maximum value of the 2015 Financial PSUs would be as follows: Mr. Ersek—$4,920,862; Mr. Agrawal—$1,230,215;
Mr. Almeida—$984,172; Mr. Thompson—$984,172; and Ms. Scott—$902,176. Under FASB ASC Topic 718, the vesting condition related to the
TSR PSUs is considered a market condition and not a performance condition. Accordingly, there is no grant date fair value below or in excess
of the amount reflected in the table above for the named executive officers that could be calculated and disclosed based on achievement of the
underlying market condition. See Note 16 to the Consolidated Financial Statements included in our Annual Reports on Form 10-K for the years
ended December 31, 2015, 2014, and 2013, respectively, for a discussion of the relevant assumptions used in calculating the amounts reported
for the applicable year.
(3) For 2015, the amounts reflect the actual cash bonus received under the Annual Incentive Plan.
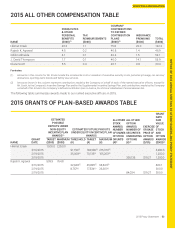
(4) Amounts included in this column for 2015 are set forth by category in the 2015 All Other Compensation Table below.
(5) For 2015, Mr. Ersek’s salary is denominated in United States dollars but is paid to or on behalf of Mr. Ersek in euros, based on a conversion rate
that was determined each calendar quarter. Contributions made to the Austrian retirement plan on behalf of Mr. Ersek are denominated in euros
and converted to United States dollars for disclosure in the proxy. The conversion rates 0.80257, 0.95284, 0.88771, and 0.88246 were applied
for quarters one, two, three and four, respectively.