Western Union 2015 Annual Report Download - page 55
Download and view the complete annual report
Please find page 55 of the 2015 Western Union annual report below. You can navigate through the pages in the report by either clicking on the pages listed below, or by using the keyword search tool below to find specific information within the annual report.-
 1
1 -
2
-
3
-
4
-
5
-
6
-
7
-
8
-
9
-
10
-
11
-
12
-
13
-
14
-
15
-
16
-
17
-
18
-
19
-
20
-
21
-
22
-
23
-
24
-
25
-
26
-
27
-
28
-
29
-
30
-
31
-
32
-
33
-
34
-
35
-
36
-
37
-
38
-
39
-
40
-
41
-
42
-
43
-
44
-
 45
45 -
 46
46 -
 47
47 -
 48
48 -
 49
49 -
 50
50 -
 51
51 -
 52
52 -
 53
53 -
 54
54 -
 55
55 -
 56
56 -
 57
57 -
 58
58 -
 59
59 -
 60
60 -
 61
61 -
 62
62 -
 63
63 -
 64
64 -
 65
65 -
66
-
67
-
68
-
69
-
70
-
71
-
72
-
73
-
74
-
75
-
76
-
77
-
78
-
79
-
80
-
81
-
82
-
83
-
84
-
85
-
86
-
87
-
88
-
89
-
90
-
91
-
92
-
93
-
94
-
95
-
96
-
97
-
98
-
99
-
100
-
101
-
102
-
103
-
104
-
105
-
106
-
107
-
108
-
109
-
110
-
111
-
112
-
113
-
114
-
115
-
116
-
117
-
118
-
119
-
120
-
121
-
122
-
123
-
124
-
125
-
126
-
127
-
128
-
129
-
130
-
131
-
132
-
133
-
134
-
135
-
136
-
137
-
138
-
139
-
140
-
141
-
142
-
143
-
144
-
145
-
146
-
147
-
148
-
149
-
150
-
151
-
152
-
153
-
154
-
155
-
156
-
157
-
158
-
159
-
160
-
161
-
162
-
163
-
164
-
165
-
166
-
167
-
168
-
169
-
170
-
171
-
172
-
173
-
174
-
175
-
176
-
177
-
178
-
179
-
180
-
181
-
182
-
183
-
184
-
185
-
186
-
187
-
188
-
189
-
190
-
191
-
192
-
193
-
194
-
195
-
196
-
197
-
198
-
199
-
200
-
201
-
202
-
203
-
204
-
205
-
206
-
207
-
208
-
209
-
210
-
211
-
212
-
213
-
214
-
215
-
216
-
217
-
218
-
219
-
220
-
221
-
222
-
223
-
224
-
225
-
226
-
227
-
228
-
229
-
230
-
231
-
232
-
233
-
234
-
235
-
236
-
237
-
238
-
239
-
240
-
241
-
242
-
243
-
244
-
245
-
246
-
247
-
248
-
249
-
250
-
251
-
252
-
253
-
254
-
255
-
256
-
257
-
258
-
259
-
260
-
261
-
262
-
263
-
264
-
265
-
266
 |
 |

NOTICE OF 2016 ANNUAL MEETING OF STOCKHOLDERS AND PROXY STATEMENT
2016 Proxy Statement | 37
COMPENSATION DISCUSSION AND ANALYSIS
SETTING 2015 COMPENSATION
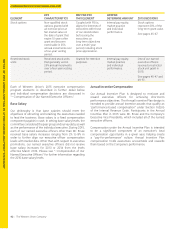
In late 2014, the Compensation Committee, working with the
Compensation Consultant and the Chief Executive Officer,
engaged in a detailed review of the Company’s executive
compensation programs to evaluate whether the design and
levels of each compensation element were:
• Appropriate to support the Company’s strategic
performance objectives;
• Consistent with the philosophy and objectives described
under “—Our Executive Compensation Philosophy and
Objectives” above; and
• Reasonable when compared to market pay practices
(see “—Market Comparison” below).
For 2015, based on a variety of factors including the “say
on pay” vote results at the Company’s recent Annual
Meetings of Stockholders and positive feedback received
during the Company’s stockholder engagement efforts,
the Compensation Committee determined to continue the
compensation program elements implemented in 2014,
as described above under “—Recent Enhancements to Our
Executive Compensation Program.” Accordingly, for 2015,
the Company’s executive compensation program continued
to be significantly weighted towards performance-based
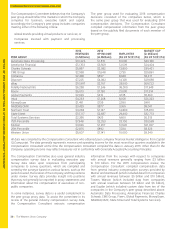
compensation and continued to include a diversified mix of
long-term incentive awards, weighted 60% Financial PSUs,
20% TSR PSUs and 20% stock options, with Company
performance under the PSUs measured over a three-year
performance period.
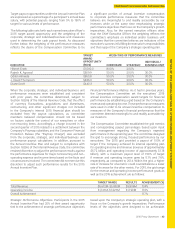
In early 2015, Mr. Ersek presented to the Compensation
Committee his evaluation of each of the Executive Vice
Presidents and the level of his or her salary, annual bonus
targets under the Annual Incentive Plan, and long-term
incentive award targets under the Long-Term Incentive
Plan. Mr. Ersek based his assessments on each executive’s
performance and relative contributions to the Company’s
success, the performance of the executive’s respective
business unit or functional area, employee retention
considerations, market data, compensation history and
internal equity. Mr. Ersek also reviewed with the committee
tally sheets that presented comprehensive historical and
current compensation data for each of the Company’s
executive officers. Please see “—Use of Tally Sheets” below
for a description of this tool. The Compensation Consultant
participated in the committee meetings to provide peer
group and market data regarding executive compensation.
Please see “—Market Comparison” for a discussion of the
use of peer group and market data.
In early 2015, Mr. Ersek also submitted a self-evaluation
to the Compensation Committee. The committee shared
Mr. Ersek’s goals for the year and his self-evaluation with the
independent members of the Board of Directors, who then
evaluated Mr. Ersek’s performance in 2014 based on his
actual performance versus such goals. In setting Mr. Ersek’s
compensation, the committee considered this evaluation,
market data regarding chief executive officer compensation
levels provided by the Compensation Consultant, and a tally
sheet of Mr. Ersek’s historical and current compensation data.
No member of management, including Mr. Ersek, made any
recommendations regarding Mr. Ersek’s compensation or
participated in the portions of the Compensation Committee
meeting or in the meeting of the independent directors
of the Board during which Mr. Ersek’s compensation was
determined or ratified.
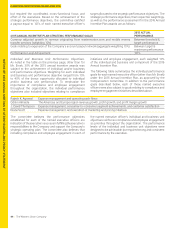
MARKET COMPARISON
For 2015, the Compensation Committee considered market
pay practices when setting executive compensation,
but did not target the specific compensation elements
or total compensation against the market data. Instead,
the committee used market data to assess the overall
competitiveness and reasonableness of the Company’s
executive compensation program. In evaluating 2015 market
data, the committee considered both peer group proxy data
and compensation survey data, but did not assign a specific
weight to either data source. While the Compensation
Committee considers relevant market pay practices when
setting executive compensation, it does not believe it
appropriate to establish compensation levels based only on
market practices. The Compensation Committee believes
that compensation decisions are complex and require
a deliberate review of Company performance and peer
compensation levels. The factors that influence the amount
of compensation awarded include market competition for
a particular position, an individual’s experience and past
performance inside or outside the Company, compensation
history, role and responsibilities within the Company, tenure
with the Company and associated institutional knowledge,
long-term potential with the Company, contributions derived
from creative and innovative thinking and leadership, money
transfer or financial services industry expertise, past and
future performance objectives and the value of the position
within the Company.