Western Union 2015 Annual Report Download - page 172
Download and view the complete annual report
Please find page 172 of the 2015 Western Union annual report below. You can navigate through the pages in the report by either clicking on the pages listed below, or by using the keyword search tool below to find specific information within the annual report.-
 1
1 -
2
-
3
-
4
-
5
-
6
-
7
-
8
-
9
-
10
-
11
-
12
-
13
-
14
-
15
-
16
-
17
-
18
-
19
-
20
-
21
-
22
-
23
-
24
-
25
-
26
-
27
-
28
-
29
-
30
-
31
-
32
-
33
-
34
-
35
-
36
-
37
-
38
-
39
-
40
-
41
-
42
-
43
-
44
-
45
-
46
-
47
-
48
-
49
-
50
-
51
-
52
-
53
-
54
-
55
-
56
-
57
-
58
-
59
-
60
-
61
-
62
-
63
-
64
-
65
-
66
-
67
-
68
-
69
-
70
-
71
-
72
-
73
-
74
-
75
-
76
-
77
-
78
-
79
-
80
-
81
-
82
-
83
-
84
-
85
-
86
-
87
-
88
-
89
-
90
-
91
-
92
-
93
-
94
-
95
-
96
-
97
-
98
-
99
-
100
-
101
-
102
-
103
-
104
-
105
-
106
-
107
-
108
-
109
-
110
-
111
-
112
-
113
-
114
-
115
-
116
-
117
-
118
-
119
-
120
-
121
-
122
-
123
-
124
-
125
-
126
-
127
-
128
-
129
-
130
-
131
-
132
-
133
-
134
-
135
-
136
-
137
-
138
-
139
-
140
-
141
-
142
-
143
-
144
-
145
-
146
-
147
-
148
-
149
-
150
-
151
-
152
-
153
-
154
-
155
-
156
-
157
-
158
-
159
-
160
-
161
-
 162
162 -
 163
163 -
 164
164 -
 165
165 -
 166
166 -
 167
167 -
 168
168 -
 169
169 -
 170
170 -
 171
171 -
 172
172 -
 173
173 -
 174
174 -
 175
175 -
 176
176 -
 177
177 -
 178
178 -
 179
179 -
 180
180 -
 181
181 -
 182
182 -
183
-
184
-
185
-
186
-
187
-
188
-
189
-
190
-
191
-
192
-
193
-
194
-
195
-
196
-
197
-
198
-
199
-
200
-
201
-
202
-
203
-
204
-
205
-
206
-
207
-
208
-
209
-
210
-
211
-
212
-
213
-
214
-
215
-
216
-
217
-
218
-
219
-
220
-
221
-
222
-
223
-
224
-
225
-
226
-
227
-
228
-
229
-
230
-
231
-
232
-
233
-
234
-
235
-
236
-
237
-
238
-
239
-
240
-
241
-
242
-
243
-
244
-
245
-
246
-
247
-
248
-
249
-
250
-
251
-
252
-
253
-
254
-
255
-
256
-
257
-
258
-
259
-
260
-
261
-
262
-
263
-
264
-
265
-
266
 |
 |

70
Revenues
2015 compared to 2014
For the year ended December 31, 2015 compared to the prior year, Business Solutions revenue decreased 1%. Fluctuations
in the exchange rate between the United States dollar and other currencies negatively impacted revenue growth by 8% for the year
ended December 31, 2015. Revenue from sales of our hedging products increased, primarily in Europe.
2014 compared to 2013
Business Solutions revenue grew 3% for the year ended December 31, 2014 compared to the prior year due to increased
customer activity, including the increased use of hedging products. Fluctuations in the exchange rate between the United States
dollar and other currencies negatively impacted revenue growth by approximately 1%.
Operating income/(loss)
2015 compared to 2014
For the year ended December 31, 2015, operating income was generated compared to an operating loss in the prior year
primarily due to benefits from and lower costs related to productivity and cost-savings initiatives. The change in operating margins
in the segment was due to these same factors.
2014 compared to 2013
For the year ended December 31, 2014, the operating loss decreased compared to the prior year due to decreased TGBP
integration expenses and the revenue increases described above, partially offset by higher bank fees and increased compliance
program costs. The change in operating loss margins in the segment was due to these same factors.
Other
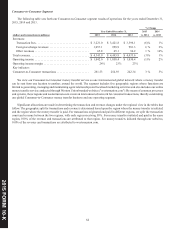
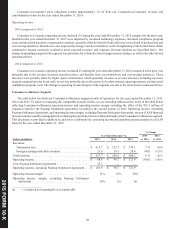
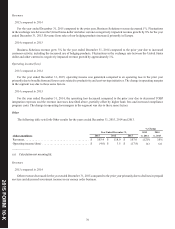
The following table sets forth Other results for the years ended December 31, 2015, 2014 and 2013.
% Change
Year Ended December 31, 2015 2014
(dollars in millions) 2015 2014 2013 vs. 2014 vs. 2013
Revenues . . . . . . . . . . . . . . . . . . . . . . . . . . . . . . . . . . . . . . . . . . . . $ 103.4 $ 118.0 $ 107.0 (12)% 10%
Operating income/(loss) . . . . . . . . . . . . . . . . . . . . . . . . . . . . . . . . $ (4.0) $ 3.5 $ (17.9) (a) (a)
____________
(a) Calculation not meaningful.
Revenues
2015 compared to 2014
Other revenue decreased for the year ended December 31, 2015 compared to the prior year primarily due to declines in prepaid
services and decreased investment income in our money order business.
201 FORM 10-K
5