Western Union 2015 Annual Report Download - page 58
Download and view the complete annual report
Please find page 58 of the 2015 Western Union annual report below. You can navigate through the pages in the report by either clicking on the pages listed below, or by using the keyword search tool below to find specific information within the annual report.-
 1
1 -
2
-
3
-
4
-
5
-
6
-
7
-
8
-
9
-
10
-
11
-
12
-
13
-
14
-
15
-
16
-
17
-
18
-
19
-
20
-
21
-
22
-
23
-
24
-
25
-
26
-
27
-
28
-
29
-
30
-
31
-
32
-
33
-
34
-
35
-
36
-
37
-
38
-
39
-
40
-
41
-
42
-
43
-
44
-
45
-
46
-
47
-
 48
48 -
 49
49 -
 50
50 -
 51
51 -
 52
52 -
 53
53 -
 54
54 -
 55
55 -
 56
56 -
 57
57 -
 58
58 -
 59
59 -
 60
60 -
 61
61 -
 62
62 -
 63
63 -
 64
64 -
 65
65 -
 66
66 -
 67
67 -
 68
68 -
69
-
70
-
71
-
72
-
73
-
74
-
75
-
76
-
77
-
78
-
79
-
80
-
81
-
82
-
83
-
84
-
85
-
86
-
87
-
88
-
89
-
90
-
91
-
92
-
93
-
94
-
95
-
96
-
97
-
98
-
99
-
100
-
101
-
102
-
103
-
104
-
105
-
106
-
107
-
108
-
109
-
110
-
111
-
112
-
113
-
114
-
115
-
116
-
117
-
118
-
119
-
120
-
121
-
122
-
123
-
124
-
125
-
126
-
127
-
128
-
129
-
130
-
131
-
132
-
133
-
134
-
135
-
136
-
137
-
138
-
139
-
140
-
141
-
142
-
143
-
144
-
145
-
146
-
147
-
148
-
149
-
150
-
151
-
152
-
153
-
154
-
155
-
156
-
157
-
158
-
159
-
160
-
161
-
162
-
163
-
164
-
165
-
166
-
167
-
168
-
169
-
170
-
171
-
172
-
173
-
174
-
175
-
176
-
177
-
178
-
179
-
180
-
181
-
182
-
183
-
184
-
185
-
186
-
187
-
188
-
189
-
190
-
191
-
192
-
193
-
194
-
195
-
196
-
197
-
198
-
199
-
200
-
201
-
202
-
203
-
204
-
205
-
206
-
207
-
208
-
209
-
210
-
211
-
212
-
213
-
214
-
215
-
216
-
217
-
218
-
219
-
220
-
221
-
222
-
223
-
224
-
225
-
226
-
227
-
228
-
229
-
230
-
231
-
232
-
233
-
234
-
235
-
236
-
237
-
238
-
239
-
240
-
241
-
242
-
243
-
244
-
245
-
246
-
247
-
248
-
249
-
250
-
251
-
252
-
253
-
254
-
255
-
256
-
257
-
258
-
259
-
260
-
261
-
262
-
263
-
264
-
265
-
266
 |
 |

NOTICE OF 2016 ANNUAL MEETING OF STOCKHOLDERS AND PROXY STATEMENT
40 | The Western Union Company
COMPENSATION DISCUSSION AND ANALYSIS
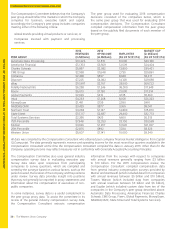
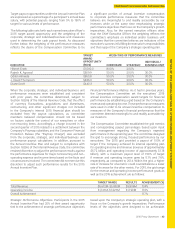
We believe the “realizable” compensation shown is reflective
of the Compensation Committee’s emphasis on “pay-for-
performance” in that differences between realizable pay and
total reported compensation, as well as fluctuations year-
over-year are primarily the result of our stock performance
and our varying levels of achievement against pre-
established performance goals under our Annual Incentive
Plan and Long-Term Incentive Plan.
2015 REALIZABLE COMPENSATION TABLE
NAME YEAR
PROXY REPORTED
COMPENSATION
($000)(1)
TOTAL REALIZABLE
COMPENSATION
($000)(2)
REALIZABLE
AS A % OF
REPORTED
Hikmet Ersek 2015 8,569.8 7,630.5 89%
2014 8,241.8 8,410.7 102%
2013 8,775.9 8,770.9 100%
Rajesh K. Agrawal 2015 2,634.5 2,399.7 91%
2014 3,378.2 3,396.7 101%
2013 3,360.5 3,353.7 100%
Odilon Almeida 2015 2,450.32,262.5 92%
2014 3,038.9 3,092.7 102%
2013 N/A N/A N/A
J. David Thompson 2015 2,532.0 2,335.9 92%
2014 2,376.4 2,451.4 103%
2013 2,233.9 2,253.4 101%
Diane Scott 2015 2,091.0 1,918.8 92%
2014 N/A N/A N/A
2013 N/A N/A N/A
Footnotes:
(1) As reported in the Total column of the 2015 Summary Compensation Table.
(2) Amounts reported in the calculation of total realizable compensation include (a) annualized base salary, (b) actual bonus payments made
to each eligible executive with respect to each of the years shown under the Company’s Annual Incentive Plan, (c) actual amounts paid with
respect to discretionary bonuses in the year in which such bonuses are earned, (d) the value realized from the exercise of stock options and for
unexercised stock options, the difference between the exercise price and the closing stock price on December 31, 2015, each reported in the
year granted, (e) the value realized upon vesting of restricted stock units or PSUs and the value of unvested restricted stock units or PSUs based
on the closing stock price on December 31, 2015, each reported in the year granted, and (f) amounts reported in the All Other Compensation
Table for the respective years. For purposes of this table, the value of the TSR PSUs is based on target performance since the TSR PSUs
vest based on the Company’s TSR at the end of the three-year performance period compared to the Company’s TSR at the beginning of the
performance period. The Financial PSUs are valued for purposes of this table based on estimated performance as of December 31, 2015.