Western Union 2015 Annual Report Download - page 59
Download and view the complete annual report
Please find page 59 of the 2015 Western Union annual report below. You can navigate through the pages in the report by either clicking on the pages listed below, or by using the keyword search tool below to find specific information within the annual report.-
 1
1 -
2
-
3
-
4
-
5
-
6
-
7
-
8
-
9
-
10
-
11
-
12
-
13
-
14
-
15
-
16
-
17
-
18
-
19
-
20
-
21
-
22
-
23
-
24
-
25
-
26
-
27
-
28
-
29
-
30
-
31
-
32
-
33
-
34
-
35
-
36
-
37
-
38
-
39
-
40
-
41
-
42
-
43
-
44
-
45
-
46
-
47
-
48
-
 49
49 -
 50
50 -
 51
51 -
 52
52 -
 53
53 -
 54
54 -
 55
55 -
 56
56 -
 57
57 -
 58
58 -
 59
59 -
 60
60 -
 61
61 -
 62
62 -
 63
63 -
 64
64 -
 65
65 -
 66
66 -
 67
67 -
 68
68 -
 69
69 -
70
-
71
-
72
-
73
-
74
-
75
-
76
-
77
-
78
-
79
-
80
-
81
-
82
-
83
-
84
-
85
-
86
-
87
-
88
-
89
-
90
-
91
-
92
-
93
-
94
-
95
-
96
-
97
-
98
-
99
-
100
-
101
-
102
-
103
-
104
-
105
-
106
-
107
-
108
-
109
-
110
-
111
-
112
-
113
-
114
-
115
-
116
-
117
-
118
-
119
-
120
-
121
-
122
-
123
-
124
-
125
-
126
-
127
-
128
-
129
-
130
-
131
-
132
-
133
-
134
-
135
-
136
-
137
-
138
-
139
-
140
-
141
-
142
-
143
-
144
-
145
-
146
-
147
-
148
-
149
-
150
-
151
-
152
-
153
-
154
-
155
-
156
-
157
-
158
-
159
-
160
-
161
-
162
-
163
-
164
-
165
-
166
-
167
-
168
-
169
-
170
-
171
-
172
-
173
-
174
-
175
-
176
-
177
-
178
-
179
-
180
-
181
-
182
-
183
-
184
-
185
-
186
-
187
-
188
-
189
-
190
-
191
-
192
-
193
-
194
-
195
-
196
-
197
-
198
-
199
-
200
-
201
-
202
-
203
-
204
-
205
-
206
-
207
-
208
-
209
-
210
-
211
-
212
-
213
-
214
-
215
-
216
-
217
-
218
-
219
-
220
-
221
-
222
-
223
-
224
-
225
-
226
-
227
-
228
-
229
-
230
-
231
-
232
-
233
-
234
-
235
-
236
-
237
-
238
-
239
-
240
-
241
-
242
-
243
-
244
-
245
-
246
-
247
-
248
-
249
-
250
-
251
-
252
-
253
-
254
-
255
-
256
-
257
-
258
-
259
-
260
-
261
-
262
-
263
-
264
-
265
-
266
 |
 |

NOTICE OF 2016 ANNUAL MEETING OF STOCKHOLDERS AND PROXY STATEMENT
2016 Proxy Statement | 41
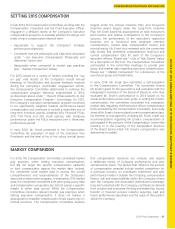
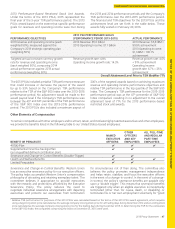
COMPENSATION DISCUSSION AND ANALYSIS
ELEMENTS OF 2015 EXECUTIVE COMPENSATION PROGRAM
The following table lists the material elements of the
Company’s 2015 executive compensation program. The
committee believes that the design of the Company’s
executive compensation program balances fixed and
variable compensation elements, provides alignment with
the Company’s short and long-term financial and strategic
priorities through the annual and long-term incentive
programs, and provides alignment with stockholder interests.
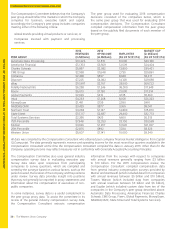
ELEMENT KEY
CHARACTERISTICS WHY WE PAY
THIS ELEMENT HOW WE
DETERMINE AMOUNT 2015 DECISIONS
Base salary Fixed compensation
component payable
in cash. Reviewed
annually and adjusted
when appropriate.
Establish a pay
foundation at
competitive levels
to attract and retain
talented executives.
Experience, job scope,
responsibilities, market
data, and individual
performance.
Except for Mr. Ersek,
each of our named
executive officers
received a base salary
increase ranging from
2% to 8%. See pages
49-51.
Annual incentive
awards
Variable compensation
component payable
in cash based on
performance against
annually established
performance
objectives.
Motivate and reward
executives for
performance on key
financial, strategic
and/or individual
objectives over the
year.
Hold our executives
accountable, with
payouts varying from
target based on actual
performance against
pre-established
and communicated
performance goals.
Internal pay equity,
market practice
and individual
performance.
Participants are
eligible to receive a
cash payout ranging
from 0% to 150%
of target based on
the achievement of
corporate financial,
strategic and
individual/business
unit goals, except
for Mr. Ersek whose
award is payable
based entirely on
the achievement of
corporate financial
and strategic goals.
Based on the
achievement of
corporate financial,
strategic and/or
individual/business
unit goals, the
committee certified
payouts ranging from
108% to 118% of
target for the named
executive officers.
See pages 42-45 and
49-51.
PSUs PSUs vest based
on the Company’s
achievement of
financial performance
objectives (Financial
PSUs) and the
Company’s relative
TSR performance (TSR
PSUs).
Coupled with stock
options, aligns
the interests of
executives with those
of our stockholders
by focusing the
executives on the
Company’s financial
and TSR performance
over a multi-year
period.
Hold our executives
accountable, with
payouts varying from
target based on actual
performance against
pre-established
and communicated
performance goals.
Internal pay equity,
market practice
and individual
performance.
Financial PSUs:
Payout based on
revenue and operating
income growth
over 2015-2017
performance period.
TSR PSUs: Payout
based on the
Company’s TSR
performance relative
to the TSR of the
S&P 500 Index
over 2015-2017
performance period.
PSUs represent 80%
of the long-term grant
value, with 60% of
the long-term grant
value delivered as
Financial PSUs and
20% delivered as
TSR PSUs.
See pages 45-47 and
49-51.