Western Union 2015 Annual Report Download - page 165
Download and view the complete annual report
Please find page 165 of the 2015 Western Union annual report below. You can navigate through the pages in the report by either clicking on the pages listed below, or by using the keyword search tool below to find specific information within the annual report.-
 1
1 -
2
-
3
-
4
-
5
-
6
-
7
-
8
-
9
-
10
-
11
-
12
-
13
-
14
-
15
-
16
-
17
-
18
-
19
-
20
-
21
-
22
-
23
-
24
-
25
-
26
-
27
-
28
-
29
-
30
-
31
-
32
-
33
-
34
-
35
-
36
-
37
-
38
-
39
-
40
-
41
-
42
-
43
-
44
-
45
-
46
-
47
-
48
-
49
-
50
-
51
-
52
-
53
-
54
-
55
-
56
-
57
-
58
-
59
-
60
-
61
-
62
-
63
-
64
-
65
-
66
-
67
-
68
-
69
-
70
-
71
-
72
-
73
-
74
-
75
-
76
-
77
-
78
-
79
-
80
-
81
-
82
-
83
-
84
-
85
-
86
-
87
-
88
-
89
-
90
-
91
-
92
-
93
-
94
-
95
-
96
-
97
-
98
-
99
-
100
-
101
-
102
-
103
-
104
-
105
-
106
-
107
-
108
-
109
-
110
-
111
-
112
-
113
-
114
-
115
-
116
-
117
-
118
-
119
-
120
-
121
-
122
-
123
-
124
-
125
-
126
-
127
-
128
-
129
-
130
-
131
-
132
-
133
-
134
-
135
-
136
-
137
-
138
-
139
-
140
-
141
-
142
-
143
-
144
-
145
-
146
-
147
-
148
-
149
-
150
-
151
-
152
-
153
-
154
-
 155
155 -
 156
156 -
 157
157 -
 158
158 -
 159
159 -
 160
160 -
 161
161 -
 162
162 -
 163
163 -
 164
164 -
 165
165 -
 166
166 -
 167
167 -
 168
168 -
 169
169 -
 170
170 -
 171
171 -
 172
172 -
 173
173 -
 174
174 -
 175
175 -
176
-
177
-
178
-
179
-
180
-
181
-
182
-
183
-
184
-
185
-
186
-
187
-
188
-
189
-
190
-
191
-
192
-
193
-
194
-
195
-
196
-
197
-
198
-
199
-
200
-
201
-
202
-
203
-
204
-
205
-
206
-
207
-
208
-
209
-
210
-
211
-
212
-
213
-
214
-
215
-
216
-
217
-
218
-
219
-
220
-
221
-
222
-
223
-
224
-
225
-
226
-
227
-
228
-
229
-
230
-
231
-
232
-
233
-
234
-
235
-
236
-
237
-
238
-
239
-
240
-
241
-
242
-
243
-
244
-
245
-
246
-
247
-
248
-
249
-
250
-
251
-
252
-
253
-
254
-
255
-
256
-
257
-
258
-
259
-
260
-
261
-
262
-
263
-
264
-
265
-
266
 |
 |

63
Earnings per share
During the years ended December 31, 2015, 2014 and 2013, basic earnings per share were $1.63, $1.60 and $1.43, respectively,
and diluted earnings per share were $1.62, $1.59 and $1.43, respectively. Outstanding options to purchase Western Union stock
and unvested shares of restricted stock are excluded from basic shares outstanding. Diluted earnings per share reflects the potential
dilution that could occur if outstanding stock options at the presented dates are exercised and shares of restricted stock have vested.
As of December 31, 2015, 2014 and 2013, there were 6.0 million, 15.5 million and 21.2 million, respectively, of outstanding
options to purchase shares of Western Union stock excluded from the diluted earnings per share calculation under the treasury
stock method as their effect was anti-dilutive.
Earnings per share for the years ended December 31, 2015 and 2014 compared to the prior year increased due to lower
weighted-average shares outstanding. Earnings per share for the year ended December 31, 2014 also increased due to the previously
described factors impacting net income. For both the years ended December 31, 2015 and 2014 compared to the prior year, the
lower number of shares outstanding was due to stock repurchases exceeding stock issuances related to the Company's stock
compensation programs.
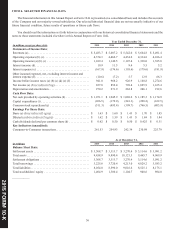
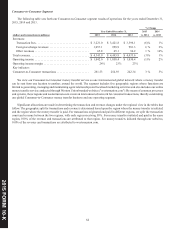
Segment Discussion
We manage our business around the consumers and businesses we serve and the types of services we offer. Each of our three
segments addresses a different combination of consumer groups, distribution networks and services offered. Our segments are
Consumer-to-Consumer, Consumer-to-Business and Business Solutions. Businesses and services not considered part of these
segments are categorized as "Other."
The business segment measurements provided to, and evaluated by, our chief operating decision maker are computed in
accordance with the following principles:
• The accounting policies of the reportable segments are the same as those described in the summary of significant accounting
policies.
• Corporate and other overhead is allocated to the segments primarily based on a percentage of the segments' revenue compared
to total revenue.
• Costs incurred for the review and closing of acquisitions are included in "Other."
• All items not included in operating income are excluded from the segments.
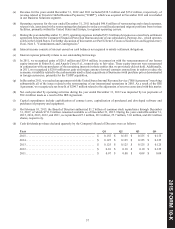
The following table sets forth the components of segment revenues as a percentage of the consolidated totals for the years
ended December 31, 2015, 2014 and 2013.
Year Ended December 31,
2015 2014 2013
Consumer-to-Consumer . . . . . . . . . . . . . . . . . . . . . . . . . . . . . . . . . . . . . . . . . . . . . . . . . . . . . . . . . . . 79% 80% 80%
Consumer-to-Business . . . . . . . . . . . . . . . . . . . . . . . . . . . . . . . . . . . . . . . . . . . . . . . . . . . . . . . . . . . . 12% 11% 11%
Business Solutions . . . . . . . . . . . . . . . . . . . . . . . . . . . . . . . . . . . . . . . . . . . . . . . . . . . . . . . . . . . . . . . 7% 7% 7%
Other . . . . . . . . . . . . . . . . . . . . . . . . . . . . . . . . . . . . . . . . . . . . . . . . . . . . . . . . . . . . . . . . . . . . . . . . . . 2% 2% 2%
100% 100% 100%
201 FORM 10 K
5 -