Western Union 2015 Annual Report Download - page 167
Download and view the complete annual report
Please find page 167 of the 2015 Western Union annual report below. You can navigate through the pages in the report by either clicking on the pages listed below, or by using the keyword search tool below to find specific information within the annual report.-
 1
1 -
2
-
3
-
4
-
5
-
6
-
7
-
8
-
9
-
10
-
11
-
12
-
13
-
14
-
15
-
16
-
17
-
18
-
19
-
20
-
21
-
22
-
23
-
24
-
25
-
26
-
27
-
28
-
29
-
30
-
31
-
32
-
33
-
34
-
35
-
36
-
37
-
38
-
39
-
40
-
41
-
42
-
43
-
44
-
45
-
46
-
47
-
48
-
49
-
50
-
51
-
52
-
53
-
54
-
55
-
56
-
57
-
58
-
59
-
60
-
61
-
62
-
63
-
64
-
65
-
66
-
67
-
68
-
69
-
70
-
71
-
72
-
73
-
74
-
75
-
76
-
77
-
78
-
79
-
80
-
81
-
82
-
83
-
84
-
85
-
86
-
87
-
88
-
89
-
90
-
91
-
92
-
93
-
94
-
95
-
96
-
97
-
98
-
99
-
100
-
101
-
102
-
103
-
104
-
105
-
106
-
107
-
108
-
109
-
110
-
111
-
112
-
113
-
114
-
115
-
116
-
117
-
118
-
119
-
120
-
121
-
122
-
123
-
124
-
125
-
126
-
127
-
128
-
129
-
130
-
131
-
132
-
133
-
134
-
135
-
136
-
137
-
138
-
139
-
140
-
141
-
142
-
143
-
144
-
145
-
146
-
147
-
148
-
149
-
150
-
151
-
152
-
153
-
154
-
155
-
156
-
 157
157 -
 158
158 -
 159
159 -
 160
160 -
 161
161 -
 162
162 -
 163
163 -
 164
164 -
 165
165 -
 166
166 -
 167
167 -
 168
168 -
 169
169 -
 170
170 -
 171
171 -
 172
172 -
 173
173 -
 174
174 -
 175
175 -
 176
176 -
 177
177 -
178
-
179
-
180
-
181
-
182
-
183
-
184
-
185
-
186
-
187
-
188
-
189
-
190
-
191
-
192
-
193
-
194
-
195
-
196
-
197
-
198
-
199
-
200
-
201
-
202
-
203
-
204
-
205
-
206
-
207
-
208
-
209
-
210
-
211
-
212
-
213
-
214
-
215
-
216
-
217
-
218
-
219
-
220
-
221
-
222
-
223
-
224
-
225
-
226
-
227
-
228
-
229
-
230
-
231
-
232
-
233
-
234
-
235
-
236
-
237
-
238
-
239
-
240
-
241
-
242
-
243
-
244
-
245
-
246
-
247
-
248
-
249
-
250
-
251
-
252
-
253
-
254
-
255
-
256
-
257
-
258
-
259
-
260
-
261
-
262
-
263
-
264
-
265
-
266
 |
 |

65
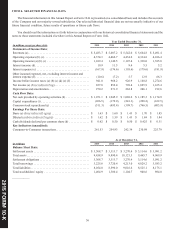
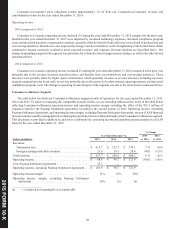
Due to the significance of our Consumer-to-Consumer segment to our overall results and the effect that foreign exchange
fluctuations against the United States dollar can have on our reported revenues, constant currency results have been provided in
the table below. Constant currency is a non-GAAP financial measure and is provided so that revenue can be viewed without the
effect of fluctuations in foreign currency exchange rates, which is consistent with how management evaluates our revenue results
and trends. This constant currency disclosure is provided in addition to, and not as a substitute for, the year-over-year percentage
change in revenue on a GAAP basis. Other companies may calculate and define similarly labeled items differently, which may
limit the usefulness of this measure for comparative purposes.
Year Ended December 31,
As Reported
Foreign Exchange
Translation Impact
Constant Currency
Growth (a)
2015 2014 2015 2014 2015 2014
Consumer-to-Consumer revenue growth/(decline):
Europe and CIS . . . . . . . . . . . . . . . . . . . . . . . . . . . . . . . (9)% 0 % (10)% (1)% 1 % 1%
North America . . . . . . . . . . . . . . . . . . . . . . . . . . . . . . . . (1)% 1 % (1)% 0 % 0 % 1%
Middle East and Africa . . . . . . . . . . . . . . . . . . . . . . . . . (4)% 2 % (5)% (1)% 1 % 3%
Asia Pacific ("APAC"). . . . . . . . . . . . . . . . . . . . . . . . . . (6)% 0 % (5)% (2)% (1)% 2%
Latin America and the Caribbean ("LACA") (b). . . . . . 2 % (6)% (7)% (8)% 9 % 2%
westernunion.com . . . . . . . . . . . . . . . . . . . . . . . . . . . . . 21 % 28 % (5)% (1)% 26 % 29%
Total Consumer-to-Consumer revenue growth/(decline): (3)% 1 % (6)% (2)% 3 % 3%
____________
(a) Constant currency revenue growth assumes that revenues denominated in foreign currencies are translated to the U.S.
dollar, net of the effect of foreign currency hedges, at rates consistent with those in the prior year.
(b) For the years ended December 31, 2015 and 2014 compared to the prior year, the foreign exchange translation impact is
primarily the result of fluctuations in the exchange rate between the United States dollar and various South American
currencies.
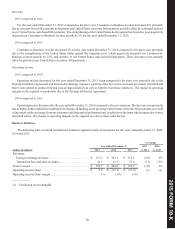
The table below sets forth transaction changes by geographic region and westernunion.com compared to the prior year and
revenues as a percentage of consolidated revenue for the years ended December 31, 2015 and 2014.
Year Ended December 31,
2015 2014
Consumer-to-Consumer transaction growth/(decline):
Europe and CIS. . . . . . . . . . . . . . . . . . . . . . . . . . . . . . . . . . . . . . . . . . . . . . . . . . . . . . . . . . . . . . . . 1 % 9%
North America . . . . . . . . . . . . . . . . . . . . . . . . . . . . . . . . . . . . . . . . . . . . . . . . . . . . . . . . . . . . . . . . 4 % 3%
Middle East and Africa . . . . . . . . . . . . . . . . . . . . . . . . . . . . . . . . . . . . . . . . . . . . . . . . . . . . . . . . . . (1)% 3%
APAC . . . . . . . . . . . . . . . . . . . . . . . . . . . . . . . . . . . . . . . . . . . . . . . . . . . . . . . . . . . . . . . . . . . . . . . (4)% 1%
LACA . . . . . . . . . . . . . . . . . . . . . . . . . . . . . . . . . . . . . . . . . . . . . . . . . . . . . . . . . . . . . . . . . . . . . . . 7 % 3%
westernunion.com. . . . . . . . . . . . . . . . . . . . . . . . . . . . . . . . . . . . . . . . . . . . . . . . . . . . . . . . . . . . . . 26 % 39%
Consumer-to-Consumer revenue as a percentage of consolidated revenue:
Europe and CIS. . . . . . . . . . . . . . . . . . . . . . . . . . . . . . . . . . . . . . . . . . . . . . . . . . . . . . . . . . . . . . . . 20 % 21%
North America . . . . . . . . . . . . . . . . . . . . . . . . . . . . . . . . . . . . . . . . . . . . . . . . . . . . . . . . . . . . . . . . 19 % 19%
Middle East and Africa . . . . . . . . . . . . . . . . . . . . . . . . . . . . . . . . . . . . . . . . . . . . . . . . . . . . . . . . . . 16 % 16%
APAC . . . . . . . . . . . . . . . . . . . . . . . . . . . . . . . . . . . . . . . . . . . . . . . . . . . . . . . . . . . . . . . . . . . . . . . 11 % 12%
LACA . . . . . . . . . . . . . . . . . . . . . . . . . . . . . . . . . . . . . . . . . . . . . . . . . . . . . . . . . . . . . . . . . . . . . . . 8 % 8%
westernunion.com. . . . . . . . . . . . . . . . . . . . . . . . . . . . . . . . . . . . . . . . . . . . . . . . . . . . . . . . . . . . . . 5 % 4%
201 FORM 10 K
5 -