Western Union 2015 Annual Report Download - page 161
Download and view the complete annual report
Please find page 161 of the 2015 Western Union annual report below. You can navigate through the pages in the report by either clicking on the pages listed below, or by using the keyword search tool below to find specific information within the annual report.-
 1
1 -
2
-
3
-
4
-
5
-
6
-
7
-
8
-
9
-
10
-
11
-
12
-
13
-
14
-
15
-
16
-
17
-
18
-
19
-
20
-
21
-
22
-
23
-
24
-
25
-
26
-
27
-
28
-
29
-
30
-
31
-
32
-
33
-
34
-
35
-
36
-
37
-
38
-
39
-
40
-
41
-
42
-
43
-
44
-
45
-
46
-
47
-
48
-
49
-
50
-
51
-
52
-
53
-
54
-
55
-
56
-
57
-
58
-
59
-
60
-
61
-
62
-
63
-
64
-
65
-
66
-
67
-
68
-
69
-
70
-
71
-
72
-
73
-
74
-
75
-
76
-
77
-
78
-
79
-
80
-
81
-
82
-
83
-
84
-
85
-
86
-
87
-
88
-
89
-
90
-
91
-
92
-
93
-
94
-
95
-
96
-
97
-
98
-
99
-
100
-
101
-
102
-
103
-
104
-
105
-
106
-
107
-
108
-
109
-
110
-
111
-
112
-
113
-
114
-
115
-
116
-
117
-
118
-
119
-
120
-
121
-
122
-
123
-
124
-
125
-
126
-
127
-
128
-
129
-
130
-
131
-
132
-
133
-
134
-
135
-
136
-
137
-
138
-
139
-
140
-
141
-
142
-
143
-
144
-
145
-
146
-
147
-
148
-
149
-
150
-
 151
151 -
 152
152 -
 153
153 -
 154
154 -
 155
155 -
 156
156 -
 157
157 -
 158
158 -
 159
159 -
 160
160 -
 161
161 -
 162
162 -
 163
163 -
 164
164 -
 165
165 -
 166
166 -
 167
167 -
 168
168 -
 169
169 -
 170
170 -
 171
171 -
172
-
173
-
174
-
175
-
176
-
177
-
178
-
179
-
180
-
181
-
182
-
183
-
184
-
185
-
186
-
187
-
188
-
189
-
190
-
191
-
192
-
193
-
194
-
195
-
196
-
197
-
198
-
199
-
200
-
201
-
202
-
203
-
204
-
205
-
206
-
207
-
208
-
209
-
210
-
211
-
212
-
213
-
214
-
215
-
216
-
217
-
218
-
219
-
220
-
221
-
222
-
223
-
224
-
225
-
226
-
227
-
228
-
229
-
230
-
231
-
232
-
233
-
234
-
235
-
236
-
237
-
238
-
239
-
240
-
241
-
242
-
243
-
244
-
245
-
246
-
247
-
248
-
249
-
250
-
251
-
252
-
253
-
254
-
255
-
256
-
257
-
258
-
259
-
260
-
261
-
262
-
263
-
264
-
265
-
266
 |
 |

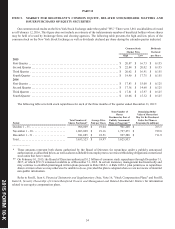
59
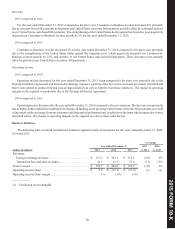
Results of Operations
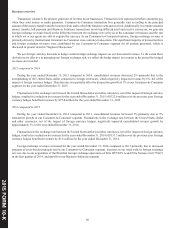
The following discussion of our consolidated results of operations and segment results refers to the year ended December 31,
2015 compared to the same period in 2014 and the year ended December 31, 2014 compared to the same period in 2013. The
results of operations should be read in conjunction with the discussion of our segment results of operations, which provide more
detailed discussions concerning certain components of the Consolidated Statements of Income. All significant intercompany
accounts and transactions between our segments have been eliminated and the below information has been prepared in conformity
with generally accepted accounting principles in the United States of America ("GAAP").
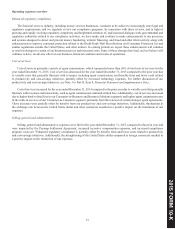
Our operating income for the year ended December 31, 2015 was negatively impacted by $35.3 million of expenses recorded
in the second quarter of 2015 for a settlement agreement between the Consumer Financial Protection Bureau (the "CFPB") and
one of our subsidiaries, Paymap, Inc., which operates solely in the United States, related to restitution, penalties, and other costs
(the "Paymap Settlement Agreement"). These charges are reflected within "Selling, general and administrative" expenses in our
Consolidated Statements of Income and have been recognized within our Consumer-to-Business operating segment.
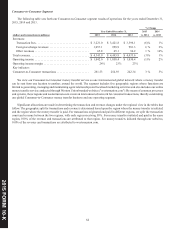
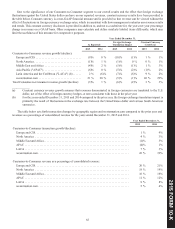
The following table sets forth our consolidated results of operations for the years ended December 31, 2015, 2014 and 2013.
% Change
Year Ended December 31, 2015 2014
(in millions, except per share amounts) 2015 2014 2013 vs. 2014 vs. 2013
Revenues:
Transaction fees. . . . . . . . . . . . . . . . . . . . . . . . . . . . . . . . . . . . . . $ 3,915.6 $ 4,083.6 $ 4,065.8 (4)% 0 %
Foreign exchange revenues . . . . . . . . . . . . . . . . . . . . . . . . . . . . . 1,436.2 1,386.3 1,348.0 4 % 3 %
Other revenues. . . . . . . . . . . . . . . . . . . . . . . . . . . . . . . . . . . . . . . 131.9 137.3 128.2 (4)% 7 %
Total revenues. . . . . . . . . . . . . . . . . . . . . . . . . . . . . . . . . . . . . . . . . . 5,483.7 5,607.2 5,542.0 (2)% 1 %
Expenses:
Cost of services . . . . . . . . . . . . . . . . . . . . . . . . . . . . . . . . . . . . . . 3,199.4 3,297.4 3,235.0 (3)% 2 %
Selling, general and administrative . . . . . . . . . . . . . . . . . . . . . . . 1,174.9 1,169.3 1,199.6 0 % (3)%
Total expenses . . . . . . . . . . . . . . . . . . . . . . . . . . . . . . . . . . . . . . . . . 4,374.3 4,466.7 4,434.6 (2)% 1 %
Operating income . . . . . . . . . . . . . . . . . . . . . . . . . . . . . . . . . . . . . . . 1,109.4 1,140.5 1,107.4 (3)% 3 %
Other income/(expense):
Interest income . . . . . . . . . . . . . . . . . . . . . . . . . . . . . . . . . . . . . . 10.9 11.5 9.4 (5)% 22 %
Interest expense . . . . . . . . . . . . . . . . . . . . . . . . . . . . . . . . . . . . . . (167.9)(176.6)(195.6) (5)% (10)%
Derivative gains/(losses), net. . . . . . . . . . . . . . . . . . . . . . . . . . . . 1.2 (2.2)(1.3) (a) (a)
Other income/(expense), net . . . . . . . . . . . . . . . . . . . . . . . . . . . . (11.8)(5.0) 7.0 (a) (a)
Total other expense, net . . . . . . . . . . . . . . . . . . . . . . . . . . . . . . . . . . (167.6)(172.3)(180.5) (3)% (5)%
Income before income taxes. . . . . . . . . . . . . . . . . . . . . . . . . . . . . . . 941.8 968.2 926.9 (3)% 4 %
Provision for income taxes. . . . . . . . . . . . . . . . . . . . . . . . . . . . . . . . 104.0 115.8 128.5 (10)% (10)%
Net income . . . . . . . . . . . . . . . . . . . . . . . . . . . . . . . . . . . . . . . . . . . . $ 837.8 $ 852.4 $ 798.4 (2)% 7 %
Earnings per share:
Basic . . . . . . . . . . . . . . . . . . . . . . . . . . . . . . . . . . . . . . . . . . . . . . $ 1.63 $ 1.60 $ 1.43 2 % 12 %
Diluted . . . . . . . . . . . . . . . . . . . . . . . . . . . . . . . . . . . . . . . . . . . . . $ 1.62 $ 1.59 $ 1.43 2 % 11 %
Weighted-average shares outstanding:
Basic . . . . . . . . . . . . . . . . . . . . . . . . . . . . . . . . . . . . . . . . . . . . . . 512.6 533.4 556.6
Diluted . . . . . . . . . . . . . . . . . . . . . . . . . . . . . . . . . . . . . . . . . . . . . 516.7 536.8 559.7
____________
(a) Calculation not meaningful
201 FORM 10 K
5 -