Western Union 2015 Annual Report Download - page 17
Download and view the complete annual report
Please find page 17 of the 2015 Western Union annual report below. You can navigate through the pages in the report by either clicking on the pages listed below, or by using the keyword search tool below to find specific information within the annual report.-
 1
1 -
2
-
3
-
4
-
5
-
6
-
 7
7 -
 8
8 -
 9
9 -
 10
10 -
 11
11 -
 12
12 -
 13
13 -
 14
14 -
 15
15 -
 16
16 -
 17
17 -
 18
18 -
 19
19 -
 20
20 -
 21
21 -
 22
22 -
 23
23 -
 24
24 -
 25
25 -
 26
26 -
 27
27 -
28
-
29
-
30
-
31
-
32
-
33
-
34
-
35
-
36
-
37
-
38
-
39
-
40
-
41
-
42
-
43
-
44
-
45
-
46
-
47
-
48
-
49
-
50
-
51
-
52
-
53
-
54
-
55
-
56
-
57
-
58
-
59
-
60
-
61
-
62
-
63
-
64
-
65
-
66
-
67
-
68
-
69
-
70
-
71
-
72
-
73
-
74
-
75
-
76
-
77
-
78
-
79
-
80
-
81
-
82
-
83
-
84
-
85
-
86
-
87
-
88
-
89
-
90
-
91
-
92
-
93
-
94
-
95
-
96
-
97
-
98
-
99
-
100
-
101
-
102
-
103
-
104
-
105
-
106
-
107
-
108
-
109
-
110
-
111
-
112
-
113
-
114
-
115
-
116
-
117
-
118
-
119
-
120
-
121
-
122
-
123
-
124
-
125
-
126
-
127
-
128
-
129
-
130
-
131
-
132
-
133
-
134
-
135
-
136
-
137
-
138
-
139
-
140
-
141
-
142
-
143
-
144
-
145
-
146
-
147
-
148
-
149
-
150
-
151
-
152
-
153
-
154
-
155
-
156
-
157
-
158
-
159
-
160
-
161
-
162
-
163
-
164
-
165
-
166
-
167
-
168
-
169
-
170
-
171
-
172
-
173
-
174
-
175
-
176
-
177
-
178
-
179
-
180
-
181
-
182
-
183
-
184
-
185
-
186
-
187
-
188
-
189
-
190
-
191
-
192
-
193
-
194
-
195
-
196
-
197
-
198
-
199
-
200
-
201
-
202
-
203
-
204
-
205
-
206
-
207
-
208
-
209
-
210
-
211
-
212
-
213
-
214
-
215
-
216
-
217
-
218
-
219
-
220
-
221
-
222
-
223
-
224
-
225
-
226
-
227
-
228
-
229
-
230
-
231
-
232
-
233
-
234
-
235
-
236
-
237
-
238
-
239
-
240
-
241
-
242
-
243
-
244
-
245
-
246
-
247
-
248
-
249
-
250
-
251
-
252
-
253
-
254
-
255
-
256
-
257
-
258
-
259
-
260
-
261
-
262
-
263
-
264
-
265
-
266
 |
 |

2016 Proxy Statement | v
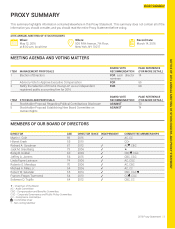
NOTICE OF 2016 ANNUAL MEETING OF STOCKHOLDERS AND PROXY STATEMENT
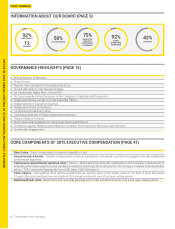
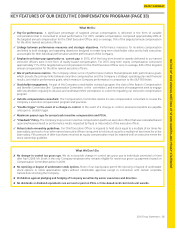
PROXY SUMMARY
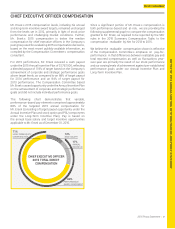
CHIEF EXECUTIVE OFFICER COMPENSATION
Mr. Ersek’s 2015 compensation levels, including his annual
and long-term incentive award targets, remained unchanged
from the levels set in 2012, primarily in light of stock price
performance and challenging market conditions. Further,
Mr. Ersek’s 2015 compensation is below the median
compensation for chief executive officers in the Company’s
peer group used for evaluating 2015 compensation decisions,
based on the most recent publicly available information, as
compiled by the Compensation Committee’s compensation
consultant.
For 2015 performance, Mr. Ersek received a cash payout
under the 2015 Annual Incentive Plan of $1,767,000, reflecting
a blended payout of 118% of target based on the Company’s
achievement of corporate and strategic performance goals
above target levels, as compared to an 88% of target payout
for 2014 performance and an 84% of target payout for
2013 performance. The Compensation Committee based
Mr. Ersek’s award opportunity under the Annual Incentive Plan
on the achievement of corporate and strategic performance
goals and did not include individual performance goals.
The following chart demonstrates that variable,
performance-based pay elements comprised approximately
88% of the targeted 2015 annual compensation for
Mr. Ersek (consisting of target payout opportunity under the
Annual Incentive Plan and stock option and PSU components
under the Long-Term Incentive Plan). Pay is based on
the annual base salary and target incentive opportunities
applicable to Mr. Ersek as of December 31, 2015.
71%
LONG-TERM EQUITY
COMPENSATION
PERFORMANCE-
BASED COMPONENT
12%
BASE SALARY
17%
ANNUAL
INCENTIVE
88%
CHIEF EXECUTIVE OFFICER
2015 TOTAL DIRECT
COMPENSATION
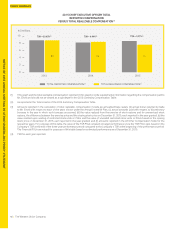
Since a significant portion of Mr. Ersek’s compensation is
both performance-based and “at-risk,” we are providing the
following supplemental graph to compare the compensation
granted to Mr. Ersek, as required to be reported by the SEC
rules in the 2015 Summary Compensation Table, to the
compensation “realizable” by him for 2013 to 2015.
We believe the “realizable” compensation shown is reflective
of the Compensation Committee’s emphasis on “pay-for-
performance” in that differences between realizable pay and
total reported compensation as well as fluctuations year-
over-year are primarily the result of our stock performance
and our varying levels of achievement against pre-established
performance goals under our Annual Incentive Plan and
Long-Term Incentive Plan.