Western Union 2015 Annual Report Download - page 158
Download and view the complete annual report
Please find page 158 of the 2015 Western Union annual report below. You can navigate through the pages in the report by either clicking on the pages listed below, or by using the keyword search tool below to find specific information within the annual report.-
 1
1 -
2
-
3
-
4
-
5
-
6
-
7
-
8
-
9
-
10
-
11
-
12
-
13
-
14
-
15
-
16
-
17
-
18
-
19
-
20
-
21
-
22
-
23
-
24
-
25
-
26
-
27
-
28
-
29
-
30
-
31
-
32
-
33
-
34
-
35
-
36
-
37
-
38
-
39
-
40
-
41
-
42
-
43
-
44
-
45
-
46
-
47
-
48
-
49
-
50
-
51
-
52
-
53
-
54
-
55
-
56
-
57
-
58
-
59
-
60
-
61
-
62
-
63
-
64
-
65
-
66
-
67
-
68
-
69
-
70
-
71
-
72
-
73
-
74
-
75
-
76
-
77
-
78
-
79
-
80
-
81
-
82
-
83
-
84
-
85
-
86
-
87
-
88
-
89
-
90
-
91
-
92
-
93
-
94
-
95
-
96
-
97
-
98
-
99
-
100
-
101
-
102
-
103
-
104
-
105
-
106
-
107
-
108
-
109
-
110
-
111
-
112
-
113
-
114
-
115
-
116
-
117
-
118
-
119
-
120
-
121
-
122
-
123
-
124
-
125
-
126
-
127
-
128
-
129
-
130
-
131
-
132
-
133
-
134
-
135
-
136
-
137
-
138
-
139
-
140
-
141
-
142
-
143
-
144
-
145
-
146
-
147
-
 148
148 -
 149
149 -
 150
150 -
 151
151 -
 152
152 -
 153
153 -
 154
154 -
 155
155 -
 156
156 -
 157
157 -
 158
158 -
 159
159 -
 160
160 -
 161
161 -
 162
162 -
 163
163 -
 164
164 -
 165
165 -
 166
166 -
 167
167 -
 168
168 -
169
-
170
-
171
-
172
-
173
-
174
-
175
-
176
-
177
-
178
-
179
-
180
-
181
-
182
-
183
-
184
-
185
-
186
-
187
-
188
-
189
-
190
-
191
-
192
-
193
-
194
-
195
-
196
-
197
-
198
-
199
-
200
-
201
-
202
-
203
-
204
-
205
-
206
-
207
-
208
-
209
-
210
-
211
-
212
-
213
-
214
-
215
-
216
-
217
-
218
-
219
-
220
-
221
-
222
-
223
-
224
-
225
-
226
-
227
-
228
-
229
-
230
-
231
-
232
-
233
-
234
-
235
-
236
-
237
-
238
-
239
-
240
-
241
-
242
-
243
-
244
-
245
-
246
-
247
-
248
-
249
-
250
-
251
-
252
-
253
-
254
-
255
-
256
-
257
-
258
-
259
-
260
-
261
-
262
-
263
-
264
-
265
-
266
 |
 |

56
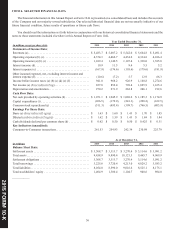
ITEM 6. SELECTED FINANCIAL DATA
The financial information in this Annual Report on Form 10-K is presented on a consolidated basis and includes the accounts
of the Company and our majority-owned subsidiaries. Our selected historical financial data are not necessarily indicative of our
future financial condition, future results of operations or future cash flows.
You should read the information set forth below in conjunction with our historical consolidated financial statements and the
notes to those statements included elsewhere in this Annual Report on Form 10-K.
Year Ended December 31,
(in millions, except per share data) 2015 2014 2013 2012 2011
Statements of Income Data:
Revenues (a). . . . . . . . . . . . . . . . . . . . . . . . . . . . . . . . . . . . . . . . . . $ 5,483.7 $ 5,607.2 $ 5,542.0 $ 5,664.8 $ 5,491.4
Operating expenses (b) (c). . . . . . . . . . . . . . . . . . . . . . . . . . . . . . . 4,374.3 4,466.7 4,434.6 4,334.8 4,106.4
Operating income (a) (b) (c) . . . . . . . . . . . . . . . . . . . . . . . . . . . . . 1,109.4 1,140.5 1,107.4 1,330.0 1,385.0
Interest income (d) . . . . . . . . . . . . . . . . . . . . . . . . . . . . . . . . . . . . . 10.9 11.5 9.4 5.5 5.2
Interest expense (e) . . . . . . . . . . . . . . . . . . . . . . . . . . . . . . . . . . . . (167.9)(176.6)(195.6)(179.6)(181.9)
Other income/(expense), net, excluding interest income and
interest expense (f). . . . . . . . . . . . . . . . . . . . . . . . . . . . . . . . . . . . . (10.6)(7.2) 5.7 12.9 66.3
Income before income taxes (a) (b) (c) (d) (e) (f) . . . . . . . . . . . . . 941.8 968.2 926.9 1,168.8 1,274.6
Net income (a) (b) (c) (d) (e) (f) (g). . . . . . . . . . . . . . . . . . . . . . . . 837.8 852.4 798.4 1,025.9 1,165.4
Depreciation and amortization. . . . . . . . . . . . . . . . . . . . . . . . . . . . 270.2 271.9 262.8 246.1 192.6
Cash Flow Data:
Net cash provided by operating activities (h) . . . . . . . . . . . . . . . . $ 1,071.1 $ 1,045.9 $ 1,088.6 $ 1,185.3 $ 1,174.9
Capital expenditures (i) . . . . . . . . . . . . . . . . . . . . . . . . . . . . . . . . . (266.5)(179.0)(241.3)(268.2)(162.5)
Common stock repurchased (j) . . . . . . . . . . . . . . . . . . . . . . . . . . . (511.3)(495.4)(399.7)(766.5)(803.9)
Earnings Per Share Data:
Basic (a) (b) (c) (d) (e) (f) (g) (j) . . . . . . . . . . . . . . . . . . . . . . . . . . $ 1.63 $ 1.60 $ 1.43 $ 1.70 $ 1.85
Diluted (a) (b) (c) (d) (e) (f) (g) (j) . . . . . . . . . . . . . . . . . . . . . . . . $ 1.62 $ 1.59 $ 1.43 $ 1.69 $ 1.84
Cash dividends declared per common share (k) . . . . . . . . . . . . . . $ 0.62 $ 0.50 $ 0.50 $ 0.425 $ 0.31
Key Indicators (unaudited):
Consumer-to-Consumer transactions. . . . . . . . . . . . . . . . . . . . . . . 261.53 254.93 242.34 230.98 225.79
As of December 31,
(in millions) 2015 2014 2013 2012 2011
Balance Sheet Data:
Settlement assets . . . . . . . . . . . . . . . . . . . . . . . . . . . . . . . . . . . . . . $ 3,308.7 $ 3,313.7 $ 3,270.4 $ 3,114.6 $ 3,091.2
Total assets . . . . . . . . . . . . . . . . . . . . . . . . . . . . . . . . . . . . . . . . . . . 9,458.9 9,890.4 10,121.3 9,465.7 9,069.9
Settlement obligations . . . . . . . . . . . . . . . . . . . . . . . . . . . . . . . . . . 3,308.7 3,313.7 3,270.4 3,114.6 3,091.2
Total borrowings . . . . . . . . . . . . . . . . . . . . . . . . . . . . . . . . . . . . . . 3,225.6 3,720.4 4,213.0 4,029.2 3,583.2
Total liabilities . . . . . . . . . . . . . . . . . . . . . . . . . . . . . . . . . . . . . . . . 8,054.0 8,590.0 9,016.6 8,525.1 8,175.1
Total stockholders’ equity . . . . . . . . . . . . . . . . . . . . . . . . . . . . . . . 1,404.9 1,300.4 1,104.7 940.6 894.8
____________
201 FORM 10-K
5