Western Union 2015 Annual Report Download - page 208
Download and view the complete annual report
Please find page 208 of the 2015 Western Union annual report below. You can navigate through the pages in the report by either clicking on the pages listed below, or by using the keyword search tool below to find specific information within the annual report.-
 1
1 -
2
-
3
-
4
-
5
-
6
-
7
-
8
-
9
-
10
-
11
-
12
-
13
-
14
-
15
-
16
-
17
-
18
-
19
-
20
-
21
-
22
-
23
-
24
-
25
-
26
-
27
-
28
-
29
-
30
-
31
-
32
-
33
-
34
-
35
-
36
-
37
-
38
-
39
-
40
-
41
-
42
-
43
-
44
-
45
-
46
-
47
-
48
-
49
-
50
-
51
-
52
-
53
-
54
-
55
-
56
-
57
-
58
-
59
-
60
-
61
-
62
-
63
-
64
-
65
-
66
-
67
-
68
-
69
-
70
-
71
-
72
-
73
-
74
-
75
-
76
-
77
-
78
-
79
-
80
-
81
-
82
-
83
-
84
-
85
-
86
-
87
-
88
-
89
-
90
-
91
-
92
-
93
-
94
-
95
-
96
-
97
-
98
-
99
-
100
-
101
-
102
-
103
-
104
-
105
-
106
-
107
-
108
-
109
-
110
-
111
-
112
-
113
-
114
-
115
-
116
-
117
-
118
-
119
-
120
-
121
-
122
-
123
-
124
-
125
-
126
-
127
-
128
-
129
-
130
-
131
-
132
-
133
-
134
-
135
-
136
-
137
-
138
-
139
-
140
-
141
-
142
-
143
-
144
-
145
-
146
-
147
-
148
-
149
-
150
-
151
-
152
-
153
-
154
-
155
-
156
-
157
-
158
-
159
-
160
-
161
-
162
-
163
-
164
-
165
-
166
-
167
-
168
-
169
-
170
-
171
-
172
-
173
-
174
-
175
-
176
-
177
-
178
-
179
-
180
-
181
-
182
-
183
-
184
-
185
-
186
-
187
-
188
-
189
-
190
-
191
-
192
-
193
-
194
-
195
-
196
-
197
-
 198
198 -
 199
199 -
 200
200 -
 201
201 -
 202
202 -
 203
203 -
 204
204 -
 205
205 -
 206
206 -
 207
207 -
 208
208 -
 209
209 -
 210
210 -
 211
211 -
 212
212 -
 213
213 -
 214
214 -
 215
215 -
 216
216 -
 217
217 -
 218
218 -
219
-
220
-
221
-
222
-
223
-
224
-
225
-
226
-
227
-
228
-
229
-
230
-
231
-
232
-
233
-
234
-
235
-
236
-
237
-
238
-
239
-
240
-
241
-
242
-
243
-
244
-
245
-
246
-
247
-
248
-
249
-
250
-
251
-
252
-
253
-
254
-
255
-
256
-
257
-
258
-
259
-
260
-
261
-
262
-
263
-
264
-
265
-
266
 |
 |

THE WESTERN UNION COMPANY
NOTES TO CONSOLIDATED FINANCIAL STATEMENTS (Continued)
106
In January 2016, the Financial Accounting Standards Board issued a new accounting pronouncement regarding classification
and measurement of financial instruments. This new standard provides guidance on how entities measure certain equity investments
and present changes in the fair value. This standard requires that entities measure certain equity investments that do not result in
consolidation and are not accounted for under the equity method at fair value and recognize any changes in fair value in net income.
The Company is required to adopt the new standard on January 1, 2018. Management is currently evaluating the potential impact
that the adoption of this standard will have on the Company's financial position, results of operations, and related disclosures.
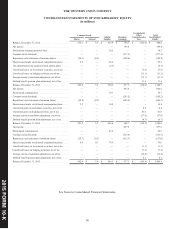
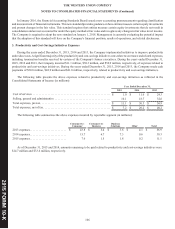
3. Productivity and Cost-Savings Initiatives Expenses
During the years ended December 31, 2015, 2014 and 2013, the Company implemented initiatives to improve productivity
and reduce costs. A significant majority of the productivity and cost-savings initiatives costs relate to severance and related expenses,
including termination benefits received by certain of the Company's former executives. During the years ended December 31,
2015, 2014 and 2013, the Company incurred $11.1 million, $30.3 million, and $56.9 million, respectively, of expenses related to
productivity and cost-savings initiatives. During the years ended December 31, 2015, 2014 and 2013, the Company made cash
payments of $30.0 million, $42.9 million and $41.8 million, respectively, related to productivity and cost-savings initiatives.
The following table presents the above expenses related to productivity and cost-savings initiatives as reflected in the
Consolidated Statements of Income (in millions):
Year Ended December 31,
2015 2014 2013
Cost of services . . . . . . . . . . . . . . . . . . . . . . . . . . . . . . . . . . . . . . . . . . . . . . . . . . . . . $ 1.0 $ 11.6 $ 24.3
Selling, general and administrative . . . . . . . . . . . . . . . . . . . . . . . . . . . . . . . . . . . . . . 10.1 18.7 32.6
Total expenses, pre-tax. . . . . . . . . . . . . . . . . . . . . . . . . . . . . . . . . . . . . . . . . . . . . . . . $ 11.1 $ 30.3 $ 56.9
Total expenses, net of tax. . . . . . . . . . . . . . . . . . . . . . . . . . . . . . . . . . . . . . . . . . . . . . $ 7.2 $ 20.2 $ 40.2
The following table summarizes the above expenses incurred by reportable segment (in millions):
Consumer-to-
Consumer
Consumer-to-
Business
Business
Solutions Other Total
2013 expenses. . . . . . . . . . . . . . . . . . . . . . . . . $ 43.8 $ 5.4 $ 3.6 $ 4.1 $ 56.9
2014 expenses. . . . . . . . . . . . . . . . . . . . . . . . . 15.7 6.7 7.3 0.6 30.3
2015 expenses. . . . . . . . . . . . . . . . . . . . . . . . . 7.6 1.5 1.8 0.2 11.1
As of December 31, 2015 and 2014, amounts remaining to be paid related to productivity and cost-savings initiatives were
$14.7 million and $33.6 million, respectively.
201 FORM 10-K
5