Western Union 2015 Annual Report Download - page 57
Download and view the complete annual report
Please find page 57 of the 2015 Western Union annual report below. You can navigate through the pages in the report by either clicking on the pages listed below, or by using the keyword search tool below to find specific information within the annual report.-
 1
1 -
2
-
3
-
4
-
5
-
6
-
7
-
8
-
9
-
10
-
11
-
12
-
13
-
14
-
15
-
16
-
17
-
18
-
19
-
20
-
21
-
22
-
23
-
24
-
25
-
26
-
27
-
28
-
29
-
30
-
31
-
32
-
33
-
34
-
35
-
36
-
37
-
38
-
39
-
40
-
41
-
42
-
43
-
44
-
45
-
46
-
 47
47 -
 48
48 -
 49
49 -
 50
50 -
 51
51 -
 52
52 -
 53
53 -
 54
54 -
 55
55 -
 56
56 -
 57
57 -
 58
58 -
 59
59 -
 60
60 -
 61
61 -
 62
62 -
 63
63 -
 64
64 -
 65
65 -
 66
66 -
 67
67 -
68
-
69
-
70
-
71
-
72
-
73
-
74
-
75
-
76
-
77
-
78
-
79
-
80
-
81
-
82
-
83
-
84
-
85
-
86
-
87
-
88
-
89
-
90
-
91
-
92
-
93
-
94
-
95
-
96
-
97
-
98
-
99
-
100
-
101
-
102
-
103
-
104
-
105
-
106
-
107
-
108
-
109
-
110
-
111
-
112
-
113
-
114
-
115
-
116
-
117
-
118
-
119
-
120
-
121
-
122
-
123
-
124
-
125
-
126
-
127
-
128
-
129
-
130
-
131
-
132
-
133
-
134
-
135
-
136
-
137
-
138
-
139
-
140
-
141
-
142
-
143
-
144
-
145
-
146
-
147
-
148
-
149
-
150
-
151
-
152
-
153
-
154
-
155
-
156
-
157
-
158
-
159
-
160
-
161
-
162
-
163
-
164
-
165
-
166
-
167
-
168
-
169
-
170
-
171
-
172
-
173
-
174
-
175
-
176
-
177
-
178
-
179
-
180
-
181
-
182
-
183
-
184
-
185
-
186
-
187
-
188
-
189
-
190
-
191
-
192
-
193
-
194
-
195
-
196
-
197
-
198
-
199
-
200
-
201
-
202
-
203
-
204
-
205
-
206
-
207
-
208
-
209
-
210
-
211
-
212
-
213
-
214
-
215
-
216
-
217
-
218
-
219
-
220
-
221
-
222
-
223
-
224
-
225
-
226
-
227
-
228
-
229
-
230
-
231
-
232
-
233
-
234
-
235
-
236
-
237
-
238
-
239
-
240
-
241
-
242
-
243
-
244
-
245
-
246
-
247
-
248
-
249
-
250
-
251
-
252
-
253
-
254
-
255
-
256
-
257
-
258
-
259
-
260
-
261
-
262
-
263
-
264
-
265
-
266
 |
 |

NOTICE OF 2016 ANNUAL MEETING OF STOCKHOLDERS AND PROXY STATEMENT
2016 Proxy Statement | 39
COMPENSATION DISCUSSION AND ANALYSIS
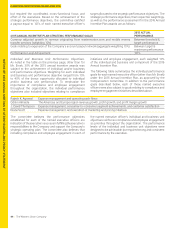
Use of Tally Sheets
The Compensation Committee reviews tally sheets that
present compensation data for each of the Company’s
executives. These tally sheets generally include historical
and current compensation data, valuations of future equity
vesting, value of option exercises in the past five years, as well
as analyses for hypothetical terminations and retirements
to allow the Compensation Committee to consider the
Company’s obligations under such circumstances. The tally
sheets provide context for the committee in determining the
elements and amounts of compensation paid.
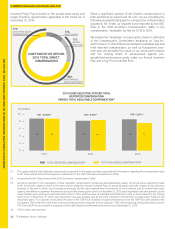
THE WESTERN UNION 2015 EXECUTIVE COMPENSATION PROGRAM
Pay-For-Performance
The principal components of the Company’s 2015 annual
executive compensation program were annual base salary,
annual incentive awards, and long-term incentive awards
in the form of stock options and PSUs. The Compensation
Committee designed the 2015 executive compensation
program so that performance-based pay elements (Annual
Incentive Plan awards, stock options and PSUs) will
continue to constitute a significant portion of the executive
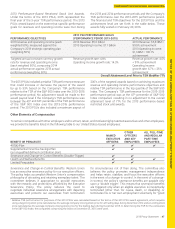
compensation awarded, determined at target levels. The
following charts demonstrate that these variable pay
elements comprised approximately 88% of the targeted
annual compensation for the Chief Executive Officer and,
on average, 76% of the targeted annual compensation for
the other named executive officers (excluding the 2015
retention restricted stock unit grant to Mr. Thompson). For
purposes of these charts, the percentage of targeted annual
compensation was determined based on the annual base
salary and target incentive opportunities applicable to the
named executive officer as of December31, 2015.
54%
LONG-TERM EQUITY
COMPENSATION 24%
BASE SALARY
22%
ANNUAL
INCENTIVE
71%
LONG-TERM EQUITY
COMPENSATION
CHIEF EXECUTIVE OFFICER
2015 TOTAL DIRECT
COMPENSATION
12%
BASE SALARY
17%
ANNUAL
INCENTIVE
88% 76%
PERFORMANCE-BASED
COMPONENT
NAMED EXECUTIVE OFFICER
2015 TOTAL DIRECT
COMPENSATION
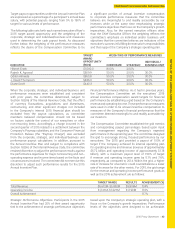
Since a significant portion of the compensation of our named
executive officers is both performance-based and “at-risk,”
we are providing the following supplemental table to compare
the compensation granted to our named executive officers,
as required to be reported by SEC rules in the 2015 Summary
Compensation Table, to the compensation “realizable” by
such named executive officers for the 2013 to 2015 fiscal
years. While the manner for reporting equity compensation as
“realizable” compensation differs from the SEC rules relating
to the reporting of compensation in the 2015 Summary
Compensation Table, we believe this table serves as a useful
supplement to the 2015 Summary Compensation Table. The
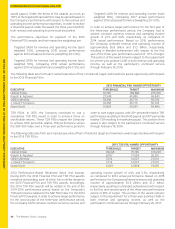
2015 Realizable Compensation Table and the total realizable
compensation reported in the table provides supplemental
information regarding the compensation paid to the named
executive officers and should not be viewed as a substitute
for the 2015 Summary Compensation Table.