Western Union 2015 Annual Report Download - page 61
Download and view the complete annual report
Please find page 61 of the 2015 Western Union annual report below. You can navigate through the pages in the report by either clicking on the pages listed below, or by using the keyword search tool below to find specific information within the annual report.-
 1
1 -
2
-
3
-
4
-
5
-
6
-
7
-
8
-
9
-
10
-
11
-
12
-
13
-
14
-
15
-
16
-
17
-
18
-
19
-
20
-
21
-
22
-
23
-
24
-
25
-
26
-
27
-
28
-
29
-
30
-
31
-
32
-
33
-
34
-
35
-
36
-
37
-
38
-
39
-
40
-
41
-
42
-
43
-
44
-
45
-
46
-
47
-
48
-
49
-
50
-
 51
51 -
 52
52 -
 53
53 -
 54
54 -
 55
55 -
 56
56 -
 57
57 -
 58
58 -
 59
59 -
 60
60 -
 61
61 -
 62
62 -
 63
63 -
 64
64 -
 65
65 -
 66
66 -
 67
67 -
 68
68 -
 69
69 -
 70
70 -
 71
71 -
72
-
73
-
74
-
75
-
76
-
77
-
78
-
79
-
80
-
81
-
82
-
83
-
84
-
85
-
86
-
87
-
88
-
89
-
90
-
91
-
92
-
93
-
94
-
95
-
96
-
97
-
98
-
99
-
100
-
101
-
102
-
103
-
104
-
105
-
106
-
107
-
108
-
109
-
110
-
111
-
112
-
113
-
114
-
115
-
116
-
117
-
118
-
119
-
120
-
121
-
122
-
123
-
124
-
125
-
126
-
127
-
128
-
129
-
130
-
131
-
132
-
133
-
134
-
135
-
136
-
137
-
138
-
139
-
140
-
141
-
142
-
143
-
144
-
145
-
146
-
147
-
148
-
149
-
150
-
151
-
152
-
153
-
154
-
155
-
156
-
157
-
158
-
159
-
160
-
161
-
162
-
163
-
164
-
165
-
166
-
167
-
168
-
169
-
170
-
171
-
172
-
173
-
174
-
175
-
176
-
177
-
178
-
179
-
180
-
181
-
182
-
183
-
184
-
185
-
186
-
187
-
188
-
189
-
190
-
191
-
192
-
193
-
194
-
195
-
196
-
197
-
198
-
199
-
200
-
201
-
202
-
203
-
204
-
205
-
206
-
207
-
208
-
209
-
210
-
211
-
212
-
213
-
214
-
215
-
216
-
217
-
218
-
219
-
220
-
221
-
222
-
223
-
224
-
225
-
226
-
227
-
228
-
229
-
230
-
231
-
232
-
233
-
234
-
235
-
236
-
237
-
238
-
239
-
240
-
241
-
242
-
243
-
244
-
245
-
246
-
247
-
248
-
249
-
250
-
251
-
252
-
253
-
254
-
255
-
256
-
257
-
258
-
259
-
260
-
261
-
262
-
263
-
264
-
265
-
266
 |
 |

NOTICE OF 2016 ANNUAL MEETING OF STOCKHOLDERS AND PROXY STATEMENT
2016 Proxy Statement | 43
COMPENSATION DISCUSSION AND ANALYSIS
Target payout opportunities under the Annual Incentive Plan
are expressed as a percentage of a participant’s annual base
salary, with potential payouts ranging from 0% to 150% of
target for various levels of performance.
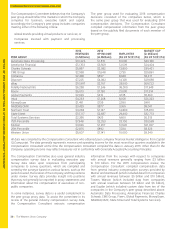
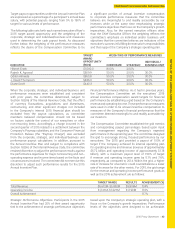
The following table sets forth each named executive officer’s
2015 target award opportunity and the weighting of the
corporate, strategic and individual/business unit measures
used in determining the cash payout levels. As discussed
further below, the weighting of the performance measures
reflects the desire of the Compensation Committee to tie
a significant portion of annual incentive compensation
to corporate performance measures that the committee
believes are meaningful to and readily accessible by our
investors while at the same time emphasizing strategic
performance objectives that focus on the Company’s growth
imperatives. Also, for the named executive officers other
than the Chief Executive Officer, the weighting reflects the
committee’s emphasis on individual and/or business unit
objectives that the committee believes are indicators of the
executive’s success in fulfilling the executive’s responsibilities
and that support the Company’s strategic operating plan.
TARGET
AWARD
OPPORTUNITY
($000)
WEIGHTING OF PERFORMANCE MEASURES
EXECUTIVE CORPORATE STRATEGIC INDIVIDUAL/
BUSINESS UNIT
Hikmet Ersek $1,500.0 80.0% 20.0% —
Rajesh K. Agrawal $509.9 50.0% 20.0% 30.0%
Odilon Almeida $550.8 50.0% 20.0% 30.0%
J. David Thompson $486.0 50.0% 20.0% 30.0%
Diane Scott $440.3 50.0% 20.0% 30.0%
When the corporate, strategic, and individual/business unit
performance measures were established and consistent
with prior years, the committee determined, subject to
Section 162(m) of the Internal Revenue Code, that the effect
of currency fluctuations, acquisitions and divestitures,
restructuring, and other significant charges not included
in the Company’s internal 2015 financial plan should be
excluded from the payout calculations, as committee
members believed compensation should not be based
on factors outside the control of our executives or other
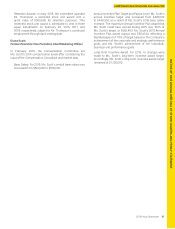
non-recurring items. Accordingly, a charge incurred in the
second quarter of 2015 related to a settlement between the
Company’s Paymap subsidiary and the Consumer Financial
Protection Bureau (the “Paymap Charge”) was excluded
from the corporate, strategic, and individual/business unit
performance payout calculations. In addition, pursuant to
the Annual Incentive Plan and subject to compliance with
Section 162(m) of the Internal Revenue Code, the committee
retained discretion to adjust the performance results against
the performance objectives for major nonrecurring and non-
operating expense and income items based on the facts and
circumstances involved. The committee did not exercise this
discretion to adjust such performance results for the 2015
Annual Incentive Plan.
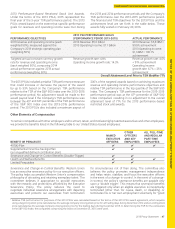
Financial Performance Metrics. As it had in previous years,
the Compensation Committee set the executives’ 2015
annual incentive compensation award targets for financial
performance by establishing a grid based on the Company’s
revenue and operating income. These performance measures
were used in order to tie annual incentive compensation to
measures of the Company’s financial performance that the
committee deemed meaningful to and readily accessible by
our investors.
The Compensation Committee established the grid metrics
and corresponding payout percentages based upon input
from management regarding the Company’s expected
performance in the upcoming year. The committee designed
the grid to encourage strong, focused performance by our
executives. The 2015 grid provided a payout of 100% of
target if the Company achieved its internal operating plan
for operating income and revenue (revenue of approximately
$5.72 billion and operating income of approximately $1.18
billion), with a maximum payout level of 150% of target
if revenue and operating income grew by 5.1% and 7.6%,
respectively, as compared to 2014. Within the grid, a higher
rate of increase for one metric could counterbalance a lower
rate of increase for the other metric. For 2015, the grid range
for the revenue and operating income performance goals as
well as the 2015 achievement are as follows:
TARGET RANGE RESULTS ACHIEVEMENT (%)
Total Revenue $5,612M-$5,892M $5,806M124%
Operating Income $1,147M-$1,227M $1,190M110%
Overall Achievement 117%
Strategic Performance Objectives. Participants in the 2015
Annual Incentive Plan had 20% of their award opportunity
tied to the achievement of strategic performance objectives
based upon the Company’s strategic operating plan, with a
focus on the Company’s growth imperatives. Performance
levels of the objectives were designed to be achievable,