Western Union 2015 Annual Report Download - page 171
Download and view the complete annual report
Please find page 171 of the 2015 Western Union annual report below. You can navigate through the pages in the report by either clicking on the pages listed below, or by using the keyword search tool below to find specific information within the annual report.-
 1
1 -
2
-
3
-
4
-
5
-
6
-
7
-
8
-
9
-
10
-
11
-
12
-
13
-
14
-
15
-
16
-
17
-
18
-
19
-
20
-
21
-
22
-
23
-
24
-
25
-
26
-
27
-
28
-
29
-
30
-
31
-
32
-
33
-
34
-
35
-
36
-
37
-
38
-
39
-
40
-
41
-
42
-
43
-
44
-
45
-
46
-
47
-
48
-
49
-
50
-
51
-
52
-
53
-
54
-
55
-
56
-
57
-
58
-
59
-
60
-
61
-
62
-
63
-
64
-
65
-
66
-
67
-
68
-
69
-
70
-
71
-
72
-
73
-
74
-
75
-
76
-
77
-
78
-
79
-
80
-
81
-
82
-
83
-
84
-
85
-
86
-
87
-
88
-
89
-
90
-
91
-
92
-
93
-
94
-
95
-
96
-
97
-
98
-
99
-
100
-
101
-
102
-
103
-
104
-
105
-
106
-
107
-
108
-
109
-
110
-
111
-
112
-
113
-
114
-
115
-
116
-
117
-
118
-
119
-
120
-
121
-
122
-
123
-
124
-
125
-
126
-
127
-
128
-
129
-
130
-
131
-
132
-
133
-
134
-
135
-
136
-
137
-
138
-
139
-
140
-
141
-
142
-
143
-
144
-
145
-
146
-
147
-
148
-
149
-
150
-
151
-
152
-
153
-
154
-
155
-
156
-
157
-
158
-
159
-
160
-
 161
161 -
 162
162 -
 163
163 -
 164
164 -
 165
165 -
 166
166 -
 167
167 -
 168
168 -
 169
169 -
 170
170 -
 171
171 -
 172
172 -
 173
173 -
 174
174 -
 175
175 -
 176
176 -
 177
177 -
 178
178 -
 179
179 -
 180
180 -
 181
181 -
182
-
183
-
184
-
185
-
186
-
187
-
188
-
189
-
190
-
191
-
192
-
193
-
194
-
195
-
196
-
197
-
198
-
199
-
200
-
201
-
202
-
203
-
204
-
205
-
206
-
207
-
208
-
209
-
210
-
211
-
212
-
213
-
214
-
215
-
216
-
217
-
218
-
219
-
220
-
221
-
222
-
223
-
224
-
225
-
226
-
227
-
228
-
229
-
230
-
231
-
232
-
233
-
234
-
235
-
236
-
237
-
238
-
239
-
240
-
241
-
242
-
243
-
244
-
245
-
246
-
247
-
248
-
249
-
250
-
251
-
252
-
253
-
254
-
255
-
256
-
257
-
258
-
259
-
260
-
261
-
262
-
263
-
264
-
265
-
266
 |
 |

69
Revenues
2015 compared to 2014
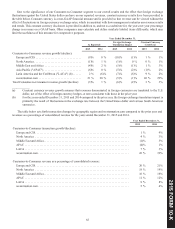
For the year ended December 31, 2015 compared to the prior year, Consumer-to-Business revenue increased 6%, primarily
due to increases in our bill payments in Argentina and United States electronic bill payments, partially offset by continued declines
in our United States cash-based bill payments. The strengthening of the United States dollar against the Argentine peso negatively
impacted our Consumer-to-Business revenue growth by 5% for the year ended December 31, 2015.
2014 compared to 2013
Consumer-to-Business revenue decreased 2% for the year ended December 31, 2014 compared to the prior year, primarily
due to the strengthening of the United States dollar against the Argentine peso, which negatively impacted our Consumer-to-
Business revenue growth by 12%, and declines in our United States cash-based bill payments. These decreases were partially
offset by growth in our United States electronic bill payments.
Operating income
2015 compared to 2014
Operating income decreased for the year ended December 31, 2015 when compared to the prior year, primarily due to the
Paymap Settlement Agreement and increased technology expenses, partially offset by revenue increases previously described and
lower costs related to productivity and cost-savings initiatives as well as benefits from those initiatives. The change in operating
margins in the segment was primarily due to the Paymap Settlement Agreement.
2014 compared to 2013
Operating income decreased for the year ended December 31, 2014 compared to the previous year. The decrease was primarily
due to higher bank-related fees resulting from changes in funding in our growing United States electronic bill payments as a result
of increased credit card usage from our customers and larger principal transactions, in addition to the items which impacted revenues
described earlier. The change in operating margins in the segment was due to these same factors.
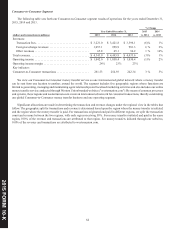
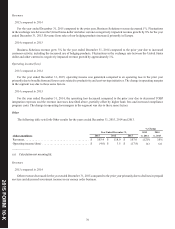
Business Solutions
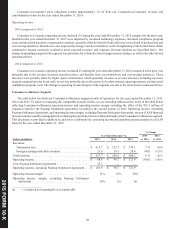
The following table sets forth our Business Solutions segment results of operations for the years ended December 31, 2015,
2014 and 2013.
% Change
Year Ended December 31, 2015 2014
(dollars in millions) 2015 2014 2013 vs. 2014 vs. 2013
Revenues:
Foreign exchange revenues . . . . . . . . . . . . . . . . . . . . . . . . . . . $ 357.2 $ 363.1 $ 355.5 (2)% 2%
Transaction fees and other revenues. . . . . . . . . . . . . . . . . . . . . 41.5 41.5 37.4 0 % 11%
Total revenues . . . . . . . . . . . . . . . . . . . . . . . . . . . . . . . . . . . . . . . . $ 398.7 $ 404.6 $ 392.9 (1)% 3%
Operating income/(loss) . . . . . . . . . . . . . . . . . . . . . . . . . . . . . . . . $ 2.8 $ (12.1) $ (27.0) (a) (a)
Operating income/(loss) margin . . . . . . . . . . . . . . . . . . . . . . . . . . 1% (3)% (7)%
____________
(a) Calculation not meaningful.
201 FORM 10 K
5 -