Western Union 2015 Annual Report Download - page 50
Download and view the complete annual report
Please find page 50 of the 2015 Western Union annual report below. You can navigate through the pages in the report by either clicking on the pages listed below, or by using the keyword search tool below to find specific information within the annual report.-
 1
1 -
 2
2 -
 3
3 -
 4
4 -
 5
5 -
 6
6 -
 7
7 -
 8
8 -
 9
9 -
 10
10 -
 11
11 -
 12
12 -
 13
13 -
 14
14 -
 15
15 -
 16
16 -
 17
17 -
 18
18 -
 19
19 -
 20
20 -
 21
21 -
 22
22 -
 23
23 -
 24
24 -
 25
25 -
 26
26 -
 27
27 -
 28
28 -
 29
29 -
 30
30 -
 31
31 -
 32
32 -
 33
33 -
 34
34 -
 35
35 -
 36
36 -
 37
37 -
 38
38 -
 39
39 -
 40
40 -
 41
41 -
 42
42 -
 43
43 -
 44
44 -
 45
45 -
 46
46 -
 47
47 -
 48
48 -
 49
49 -
 50
50 -
 51
51 -
 52
52 -
 53
53 -
 54
54 -
 55
55 -
 56
56 -
 57
57 -
 58
58 -
 59
59 -
 60
60 -
 61
61 -
 62
62 -
 63
63 -
 64
64 -
 65
65 -
 66
66 -
 67
67 -
 68
68 -
 69
69 -
 70
70 -
 71
71 -
 72
72 -
 73
73 -
 74
74 -
 75
75 -
 76
76 -
 77
77 -
 78
78 -
 79
79 -
 80
80 -
 81
81 -
 82
82 -
 83
83 -
 84
84 -
 85
85 -
 86
86 -
 87
87 -
 88
88 -
 89
89 -
 90
90 -
 91
91 -
 92
92 -
 93
93 -
 94
94 -
 95
95 -
 96
96 -
 97
97 -
 98
98 -
 99
99 -
 100
100 -
 101
101 -
 102
102 -
 103
103 -
 104
104 -
 105
105 -
 106
106 -
 107
107 -
 108
108 -
 109
109 -
 110
110 -
 111
111 -
 112
112 -
 113
113 -
 114
114 -
 115
115 -
 116
116 -
 117
117 -
 118
118 -
 119
119 -
 120
120 -
 121
121 -
 122
122 -
 123
123 -
 124
124 -
 125
125 -
 126
126 -
 127
127 -
 128
128 -
 129
129 -
 130
130 -
 131
131 -
 132
132 -
 133
133 -
 134
134 -
 135
135 -
 136
136 -
 137
137 -
 138
138 -
 139
139 -
 140
140 -
 141
141 -
 142
142 -
 143
143 -
 144
144 -
 145
145 -
 146
146 -
 147
147 -
 148
148 -
 149
149 -
 150
150 -
 151
151 -
 152
152 -
 153
153 -
 154
154 -
 155
155 -
 156
156 -
 157
157 -
 158
158 -
 159
159 -
 160
160 -
 161
161 -
 162
162 -
 163
163 -
 164
164 -
 165
165 -
 166
166 -
 167
167 -
 168
168 -
 169
169 -
 170
170 -
 171
171 -
 172
172 -
 173
173 -
 174
174 -
 175
175 -
 176
176 -
 177
177 -
 178
178 -
 179
179 -
 180
180 -
 181
181 -
 182
182 -
 183
183 -
 184
184 -
 185
185 -
 186
186 -
 187
187 -
 188
188 -
 189
189 -
 190
190 -
 191
191 -
 192
192 -
 193
193 -
 194
194 -
 195
195 -
 196
196 -
 197
197 -
 198
198 -
 199
199 -
 200
200 -
 201
201 -
 202
202 -
 203
203 -
 204
204 -
 205
205 -
 206
206 -
 207
207 -
 208
208 -
 209
209 -
 210
210 -
 211
211 -
 212
212 -
 213
213 -
 214
214 -
 215
215 -
 216
216 -
 217
217 -
 218
218 -
 219
219 -
 220
220 -
 221
221 -
 222
222 -
 223
223 -
 224
224 -
 225
225 -
 226
226 -
 227
227 -
 228
228 -
 229
229 -
 230
230 -
 231
231 -
 232
232 -
 233
233 -
 234
234 -
 235
235 -
 236
236 -
 237
237 -
 238
238 -
 239
239 -
 240
240 -
 241
241 -
 242
242 -
 243
243 -
 244
244 -
 245
245 -
 246
246 -
 247
247 -
 248
248 -
 249
249 -
 250
250 -
 251
251 -
 252
252 -
 253
253 -
 254
254 -
 255
255 -
 256
256 -
 257
257 -
 258
258 -
 259
259 -
 260
260 -
 261
261 -
 262
262 -
 263
263 -
 264
264 -
 265
265 -
 266
266
 |
 |

NOTICE OF 2016 ANNUAL MEETING OF STOCKHOLDERS AND PROXY STATEMENT
32 | The Western Union Company
COMPENSATION DISCUSSION AND ANALYSIS
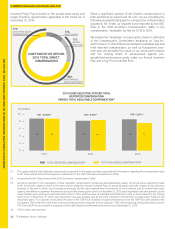
Incentive Plan). Pay is based on the annual base salary and
target incentive opportunities applicable to Mr. Ersek as of
December 31, 2015.
71%
LONG-TERM EQUITY
COMPENSATION
PERFORMANCE-
BASED COMPONENT
12%
BASE SALARY
17%
ANNUAL
INCENTIVE
88%
CHIEF EXECUTIVE OFFICER
2015 TOTAL DIRECT
COMPENSATION
Since a significant portion of Mr. Ersek’s compensation is
both performance-based and “at-risk,” we are providing the
following supplemental graph to compare the compensation
granted to Mr. Ersek, as required to be reported by the SEC
rules in the 2015 Summary Compensation Table, to the
compensation “realizable” by him for 2013 to 2015.
We believe the “realizable” compensation shown is reflective
of the Compensation Committee’s emphasis on “pay-for-
performance” in that differences between realizable pay and
total reported compensation, as well as fluctuations year-
over-year are primarily the result of our stock performance
and our varying levels of achievement against pre-
established performance goals under our Annual Incentive
Plan and Long-Term Incentive Plan.
2015 CHIEF EXECUTIVE OFFICER TOTAL
REPORTED COMPENSATION
VERSUS TOTAL REALIZABLE COMPENSATION(1)
In $ millions
2013 2014 2015
8.8 8.8 8.2 8.4 8.6 7.6
TSR = 30.65%(4) TSR = 6.94%(4) TSR = 3.27%(4)
TOTAL REPORTED COMPENSATION(2) TOTAL REALIZABLE COMPENSATION(3)
0
2
4
6
8
10
(1) This graph and the total realizable compensation reported in this graph provides supplemental information regarding the compensation paid
to Mr. Ersek and should not be viewed as a substitute for the 2015 Summary Compensation Table.
(2) As reported in the Total column of the 2015 Summary Compensation Table.
(3) Amounts reported in the calculation of total realizable compensation include (a) annualized base salary, (b) actual bonus payments made
to Mr. Ersek with respect to each of the years shown under the Annual Incentive Plan, (c) actual amounts paid with respect to discretionary
bonuses in the year in which such bonuses are earned, (d) the value realized from the exercise of stock options and for unexercised stock
options, the difference between the exercise price and the closing stock price on December 31, 2015, each reported in the year granted, (e) the
value realized upon vesting of restricted stock units or PSUs and the value of unvested restricted stock units or PSUs based on the closing
stock price on December 31, 2015, each reported in the year granted, and (f) amounts reported in the All Other Compensation Table for the
respective years. For purposes of this table, the value of the TSR PSUs is based on target performance since the TSR PSUs vest based on the
Company’s TSR at the end of the three-year performance period compared to the Company’s TSR at the beginning of the performance period.
The Financial PSUs are valued for purposes of this table based on estimated performance as of December 31, 2015.
(4) TSR for each year reported.
