Western Union 2015 Annual Report Download - page 64
Download and view the complete annual report
Please find page 64 of the 2015 Western Union annual report below. You can navigate through the pages in the report by either clicking on the pages listed below, or by using the keyword search tool below to find specific information within the annual report.-
 1
1 -
2
-
3
-
4
-
5
-
6
-
7
-
8
-
9
-
10
-
11
-
12
-
13
-
14
-
15
-
16
-
17
-
18
-
19
-
20
-
21
-
22
-
23
-
24
-
25
-
26
-
27
-
28
-
29
-
30
-
31
-
32
-
33
-
34
-
35
-
36
-
37
-
38
-
39
-
40
-
41
-
42
-
43
-
44
-
45
-
46
-
47
-
48
-
49
-
50
-
51
-
52
-
53
-
 54
54 -
 55
55 -
 56
56 -
 57
57 -
 58
58 -
 59
59 -
 60
60 -
 61
61 -
 62
62 -
 63
63 -
 64
64 -
 65
65 -
 66
66 -
 67
67 -
 68
68 -
 69
69 -
 70
70 -
 71
71 -
 72
72 -
 73
73 -
 74
74 -
75
-
76
-
77
-
78
-
79
-
80
-
81
-
82
-
83
-
84
-
85
-
86
-
87
-
88
-
89
-
90
-
91
-
92
-
93
-
94
-
95
-
96
-
97
-
98
-
99
-
100
-
101
-
102
-
103
-
104
-
105
-
106
-
107
-
108
-
109
-
110
-
111
-
112
-
113
-
114
-
115
-
116
-
117
-
118
-
119
-
120
-
121
-
122
-
123
-
124
-
125
-
126
-
127
-
128
-
129
-
130
-
131
-
132
-
133
-
134
-
135
-
136
-
137
-
138
-
139
-
140
-
141
-
142
-
143
-
144
-
145
-
146
-
147
-
148
-
149
-
150
-
151
-
152
-
153
-
154
-
155
-
156
-
157
-
158
-
159
-
160
-
161
-
162
-
163
-
164
-
165
-
166
-
167
-
168
-
169
-
170
-
171
-
172
-
173
-
174
-
175
-
176
-
177
-
178
-
179
-
180
-
181
-
182
-
183
-
184
-
185
-
186
-
187
-
188
-
189
-
190
-
191
-
192
-
193
-
194
-
195
-
196
-
197
-
198
-
199
-
200
-
201
-
202
-
203
-
204
-
205
-
206
-
207
-
208
-
209
-
210
-
211
-
212
-
213
-
214
-
215
-
216
-
217
-
218
-
219
-
220
-
221
-
222
-
223
-
224
-
225
-
226
-
227
-
228
-
229
-
230
-
231
-
232
-
233
-
234
-
235
-
236
-
237
-
238
-
239
-
240
-
241
-
242
-
243
-
244
-
245
-
246
-
247
-
248
-
249
-
250
-
251
-
252
-
253
-
254
-
255
-
256
-
257
-
258
-
259
-
260
-
261
-
262
-
263
-
264
-
265
-
266
 |
 |

NOTICE OF 2016 ANNUAL MEETING OF STOCKHOLDERS AND PROXY STATEMENT
46 | The Western Union Company
COMPENSATION DISCUSSION AND ANALYSIS
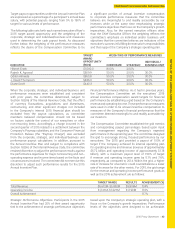
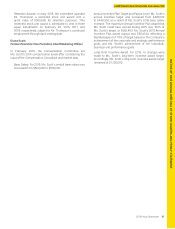
award payout. Under the terms of the awards, as much as
150% of the targeted Financial PSUs may be earned based on
the Company’s performance with respect to the revenue and
operating income performance objectives. In order to receive
a threshold payout under the award, the three-year CAGR for
both revenue and operating income must be positive.
The performance objectives for payment of the 2015
Financial PSU awards and their respective weightings are:
• Targeted CAGR for revenue and operating income (each
weighted 50%), comparing 2015 actual performance
against 2014 actual performance (weighting 33-1/3%);
• Targeted CAGR for revenue and operating income (each
weighted 50%), comparing 2016 actual performance
against 2015 actual performance (weighting 33-1/3%); and
• Targeted CAGR for revenue and operating income (each
weighted 50%), comparing 2017 actual performance
against 2016 actual performance (weighting 33-1/3%).
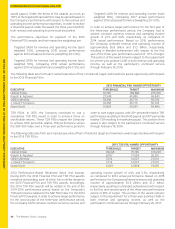
In order to achieve target performance for the first year of
the three-year performance period, the Company had to
achieve constant currency revenue and operating income
growth of 2.1% and 3.6%, respectively, as compared to
2014 actual performance. Based on 2015 performance,
the Company achieved revenue and operating income of
approximately $5.8 billion and $1.2 billion, respectively,
resulting in blended achievement with respect to the first
year of the three-year performance period of 117% of target.
This portion of the award remains subject to the requirement
for a three-year positive CAGR in both revenue and operating
income, as well as the participant’s continued service
through February 19, 2018.
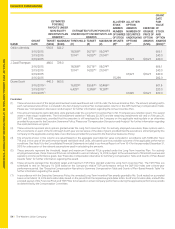
The following table sets forth each named executive officer’s threshold, target and maximum award opportunity with respect
to the 2015 Financial PSUs:
2015 FINANCIAL PSU AWARD OPPORTUNITY
EXECUTIVE THRESHOLD TARGET MAXIMUM
Hikmet Ersek 91,790 183,580 275,370
Rajesh K. Agrawal 22,948 45,895 68,843
Odilon Almeida 18,358 36,716 55,074
J. David Thompson 18,358 36,716 55,074
Diane Scott 16,829 33,657 50,486
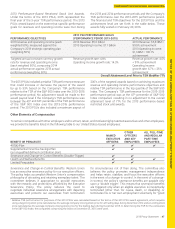
TSR PSUs. In 2015, the Company continued to use a
standalone TSR PSU award in order to enhance focus on
stockholder returns. These TSR PSUs require the Company
to achieve 60th percentile relative TSR performance versus
the S&P 500 Index over a three-year performance period in
order to earn target payout, with 30th percentile relative TSR
performance resulting in threshold payout and 90th percentile
relative TSR resulting in maximum payout. This portion of the
award is also subject to the participant’s continued service
through February 19, 2018.
The following table sets forth each named executive officer’s threshold, target and maximum award opportunities with respect
to the 2015 TSR PSUs:
2015 TSR PSU AWARD OPPORTUNITY
EXECUTIVE THRESHOLD TARGET MAXIMUM
Hikmet Ersek 35,068 70,135 105,203
Rajesh K. Agrawal 8,767 17,534 26,301
Odilon Almeida 7,014 14,027 21,041
J. David Thompson 7,014 14,027 21,041
Diane Scott 6,429 12,858 19,287
2014 Performance-Based Restricted Stock Unit Awards.
During 2015, the 2014 Financial PSU and TSR PSU awards
remained outstanding, each of which has a similar design to
the 2015 Financial PSU and TSR PSU awards. Accordingly,
the 2014 TSR PSU awards will be settled at the end of the
2014-2016 performance period based on the Company’s
TSR performance relative to the S&P 500 Index. For the 2014
Financial PSU awards, in order to achieve target performance
for the second year of the three-year performance period,
the Company had to achieve constant currency revenue and
operating income growth of 4.6% and 5.6%, respectively,
as compared to 2014 actual performance. Based on 2015
performance, the Company achieved revenues and operating
income of approximately $5.8 billion and $1.2 billion,
respectively, resulting in a blended achievement with respect
to the first and second years of the three-year performance
period of 95% of target. This portion of the award remains
subject to the requirement for a three-year positive CAGR in
both revenue and operating income, as well as the
participant’s continued service through February 20, 2017.