Western Union 2015 Annual Report Download - page 65
Download and view the complete annual report
Please find page 65 of the 2015 Western Union annual report below. You can navigate through the pages in the report by either clicking on the pages listed below, or by using the keyword search tool below to find specific information within the annual report.-
 1
1 -
2
-
3
-
4
-
5
-
6
-
7
-
8
-
9
-
10
-
11
-
12
-
13
-
14
-
15
-
16
-
17
-
18
-
19
-
20
-
21
-
22
-
23
-
24
-
25
-
26
-
27
-
28
-
29
-
30
-
31
-
32
-
33
-
34
-
35
-
36
-
37
-
38
-
39
-
40
-
41
-
42
-
43
-
44
-
45
-
46
-
47
-
48
-
49
-
50
-
51
-
52
-
53
-
54
-
 55
55 -
 56
56 -
 57
57 -
 58
58 -
 59
59 -
 60
60 -
 61
61 -
 62
62 -
 63
63 -
 64
64 -
 65
65 -
 66
66 -
 67
67 -
 68
68 -
 69
69 -
 70
70 -
 71
71 -
 72
72 -
 73
73 -
 74
74 -
 75
75 -
76
-
77
-
78
-
79
-
80
-
81
-
82
-
83
-
84
-
85
-
86
-
87
-
88
-
89
-
90
-
91
-
92
-
93
-
94
-
95
-
96
-
97
-
98
-
99
-
100
-
101
-
102
-
103
-
104
-
105
-
106
-
107
-
108
-
109
-
110
-
111
-
112
-
113
-
114
-
115
-
116
-
117
-
118
-
119
-
120
-
121
-
122
-
123
-
124
-
125
-
126
-
127
-
128
-
129
-
130
-
131
-
132
-
133
-
134
-
135
-
136
-
137
-
138
-
139
-
140
-
141
-
142
-
143
-
144
-
145
-
146
-
147
-
148
-
149
-
150
-
151
-
152
-
153
-
154
-
155
-
156
-
157
-
158
-
159
-
160
-
161
-
162
-
163
-
164
-
165
-
166
-
167
-
168
-
169
-
170
-
171
-
172
-
173
-
174
-
175
-
176
-
177
-
178
-
179
-
180
-
181
-
182
-
183
-
184
-
185
-
186
-
187
-
188
-
189
-
190
-
191
-
192
-
193
-
194
-
195
-
196
-
197
-
198
-
199
-
200
-
201
-
202
-
203
-
204
-
205
-
206
-
207
-
208
-
209
-
210
-
211
-
212
-
213
-
214
-
215
-
216
-
217
-
218
-
219
-
220
-
221
-
222
-
223
-
224
-
225
-
226
-
227
-
228
-
229
-
230
-
231
-
232
-
233
-
234
-
235
-
236
-
237
-
238
-
239
-
240
-
241
-
242
-
243
-
244
-
245
-
246
-
247
-
248
-
249
-
250
-
251
-
252
-
253
-
254
-
255
-
256
-
257
-
258
-
259
-
260
-
261
-
262
-
263
-
264
-
265
-
266
 |
 |

NOTICE OF 2016 ANNUAL MEETING OF STOCKHOLDERS AND PROXY STATEMENT
2016 Proxy Statement | 47
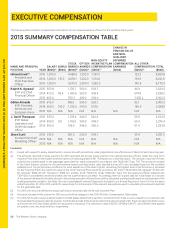
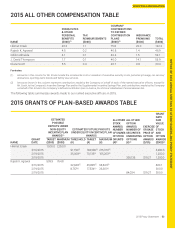
COMPENSATION DISCUSSION AND ANALYSIS
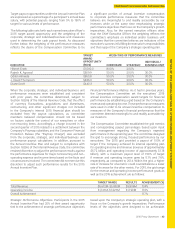
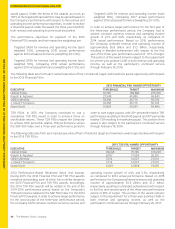
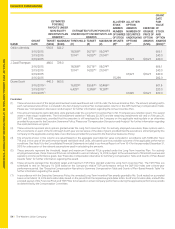
2013 Performance-Based Restricted Stock Unit Awards.
Under the terms of the 2013 PSUs, 2015 represented the
final year of the 3-year TSR performance period. The 2013
PSUs vested based on the extent that specific performance
goals for revenues and operating income were met during
the 2013 and 2014 performance periods and the Company’s
TSR performance over the 2013-2015 performance period.
The financial and TSR objectives for the 2013 PSUs and the
achievement level are set forth in the table below. These
awards fully vested on February 20, 2016.
PERFORMANCE OBJECTIVES 2013 PSU PERFORMANCE GOALS
(PERFORMANCE PERIOD 2013-2015) ACTUAL PERFORMANCE
2013 revenue and operating income (each
weighted 50%), measured against the
Company’s 2013 strategic operating plan
(weighting 50%)
2013 Revenue: $5.6 billion
2013 Operating Income: $1.1 billion
2013 Revenue: $5,618M =
99.5% achievement
2013 Operating Income:
$1,149M = 100.1%
achievement
Targeted annual constant currency growth
rate for revenue and operating income
(each weighted 50%), comparing 2014
actual performance against 2013 actual
performance (weighting 50%)
Revenue growth rate: 4.8%
Operating Income growth rate: 14.3%
Revenue growth rate: 4.0%
= 91% achievement
Operating Income
growth rate: 6.7% = 25%
achievement
Overall Attainment Level Prior to TSR Modifier 71%
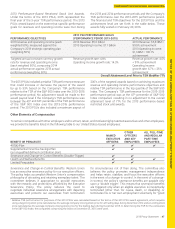
The 2013 PSUs included a relative TSR performance measure
that could increase or decrease the payout of the award
by up to 33% based on the Company’s TSR performance
relative to the TSR of the S&P 500 Index over the 2013-2015
performance period. No adjustment would be made to the
award payout level if the Company’s TSR performance was
between the 40th and 60th percentile of the TSR performance
of the S&P 500 Index over the 2013-2015 performance
period. The 2013 PSUs also included a maximum payout of
200% of the targeted awards based on achieving maximum
revenue and operating income performance objectives and
relative TSR performance in the top quartile of the S&P 500
Index. The Company’s TSR performance for the 2013-2015
performance period was at the 47th percentile of S&P 500
Index companies1 resulting in no adjustment to the overall
attainment level of 71% for the 2013 performance-based
restricted stock unit awards.
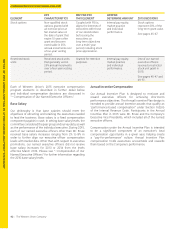
Other Elements of Compensation
To remain competitive with other employers and to attract, retain, and motivate highly talented executives and other employees,
we provide the benefits listed in the following table to our United States-based employees:
BENEFIT OR PERQUISITE
NAMED
EXECUTIVE
OFFICERS
OTHER
OFFICERS
AND KEY
EMPLOYEES
ALL FULL-TIME
AND REGULAR
PART-TIME
EMPLOYEES
401(k) Plan ✔ ✔ ✔
Supplemental Incentive Savings Plan
(a nonqualified defined contribution plan)
✔ ✔
Severance and Change-in-Control Benefits (Double-Trigger) ✔ ✔
Health and Welfare Benefits ✔ ✔ ✔
Limited Perquisites ✔ ✔
Severance and Change-in-Control Benefits. Western Union
has an executive severance policy for our executive officers.
The policy helps accomplish Western Union’s compensation
philosophy of attracting and retaining exemplary talent. The
committee believes it appropriate to provide executives
with the rewards and protections afforded by the Executive
Severance Policy. The policy reduces the need to
negotiate individual severance arrangements with departing
executives and protects our executives from termination
for circumstances not of their doing. The committee also
believes the policy promotes management independence
and helps retain, stabilize, and focus the executive officers
in the event of a change-in-control. In the event of a change-
in-control, the policy’s severance benefits are payable only
upon a “double trigger.” This means that severance benefits
are triggered only when an eligible executive is involuntarily
terminated (other than for cause, death, or disability), or
terminates his or her own employment voluntarily for “good
1 Relative TSR performance for purposes of the 2013 PSUs was calculated based on the terms of the 2013 PSU award agreement, which requires
using a beginning stock price calculated as the average company closing stock price for all trading days during December 2012 and an ending stock
price calculated as the average company closing stock price for the trading days during December 2015. In determining the TSR for the companies
in the S&P 500 Index, the companies comprising the Index on December 31, 2015 were used.