Washington Post 2013 Annual Report Download - page 95
Download and view the complete annual report
Please find page 95 of the 2013 Washington Post annual report below. You can navigate through the pages in the report by either clicking on the pages listed below, or by using the keyword search tool below to find specific information within the annual report.-
 1
1 -
2
-
3
-
4
-
5
-
6
-
7
-
8
-
9
-
10
-
11
-
12
-
13
-
14
-
15
-
16
-
17
-
18
-
19
-
20
-
21
-
22
-
23
-
24
-
25
-
26
-
27
-
28
-
29
-
30
-
31
-
32
-
33
-
34
-
35
-
36
-
37
-
38
-
39
-
40
-
41
-
42
-
43
-
44
-
45
-
46
-
47
-
48
-
49
-
50
-
51
-
52
-
53
-
54
-
55
-
56
-
57
-
58
-
59
-
60
-
61
-
62
-
63
-
64
-
65
-
66
-
67
-
68
-
69
-
70
-
71
-
72
-
73
-
74
-
75
-
76
-
77
-
78
-
79
-
80
-
81
-
82
-
83
-
84
-
 85
85 -
 86
86 -
 87
87 -
 88
88 -
 89
89 -
 90
90 -
 91
91 -
 92
92 -
 93
93 -
 94
94 -
 95
95 -
 96
96 -
 97
97 -
 98
98 -
 99
99 -
 100
100 -
 101
101 -
 102
102 -
 103
103 -
 104
104 -
 105
105 -
106
-
107
-
108
-
109
-
110
-
111
-
112
 |
 |

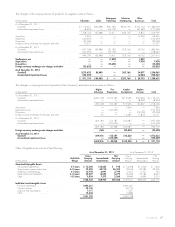
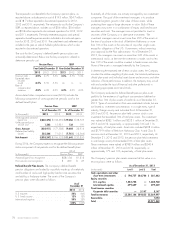
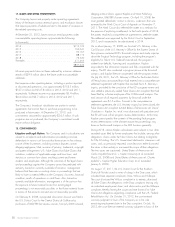
As of December 31, 2012
(in thousands) Level 1 Level 2 Total
Cash equivalents and other
short-terminvestments .... $ 195,389 $62,922 $ 258,311
Equity securities
U.S. equities ........... 1,315,378 —1,315,378
International equities ..... 482,431 —482,431
Fixed-income securities
Corporate debt securities . . —6,054 6,054
Otherfixedincome ...... 2,501 313 2,814
Total Investments ......... $1,995,699 $69,289 $2,064,988
Receivables ............. 6,157
Total .................. $2,071,145
Cash equivalents and other short-term investments. These investments are
primarily held in U.S. Treasury securities and registered money market
funds. These investments are valued using a market approach based on
the quoted market prices of the security or inputs that include quoted
market prices for similar instruments, and are classified as either Level 1
or Level 2 in the valuation hierarchy.
U.S. equities. These investments are held in common and preferred
stock of U.S. corporations and American Depositary Receipts (ADRs)
traded on U.S. exchanges. Common and preferred shares and ADRs
aretradedactivelyonexchanges,andpricequotesforthesesharesare
readily available. These investments are classified as Level 1 in the
valuation hierarchy.
International equities. These investments are held in common and preferred
stock issued by non-U.S. corporations. Common and preferred shares are
traded actively on exchanges, and price quotes for these shares are readily
available. These investments are classified as Level 1 in the valuation
hierarchy.
Corporate debt securities. These investments consist of fixed-income
securities issued by U.S. corporations and are valued using a bid evaluation
process, with bid data provided by independent pricing sources. These
investments are classified as Level 2 in the valuation hierarchy.
Other fixed income. These investments consist of fixed-income securities
issued by the U.S. Treasury and in private placements and are valued
using a quoted market price or bid evaluation process, with bid data
provided by independent pricing sources. These investments are
classified as Level 1 or Level 2 in the valuation hierarchy.
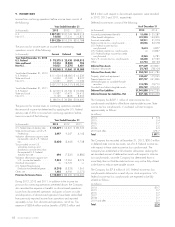
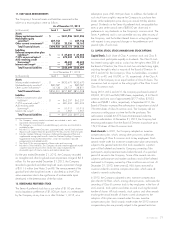
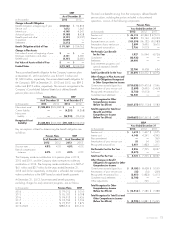
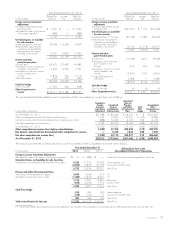
Other Postretirement Plans. The following table sets forth obligation, asset
and funding information for the Company’s other postretirement plans:
Postretirement Plans
As of December 31
(in thousands) 2013 2012
Change in Benefit Obligation
Benefit obligation at beginning of year .... $ 63,868 $ 72,412
Service cost ........................ 2,488 3,113
Interest cost ........................ 1,848 2,735
Actuarial gain ....................... (3,298) (11,493)
Curtailment ......................... (21,221) 438
Benefits paid, net of Medicare subsidy .... (3,671) (3,337)
Benefit Obligation at End of Year ........ $ 40,014 $ 63,868
Change in Plan Assets
Fair value of assets at beginning of year . . . $—$—
Employer contributions ................ 3,671 3,337
Benefits paid, net of Medicare subsidy .... (3,671) (3,337)
Fair Value of Assets at End of Year ...... $—$—
Funded Status ...................... $(40,014) $(63,868)
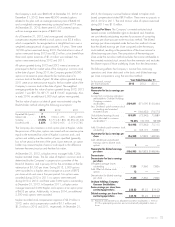
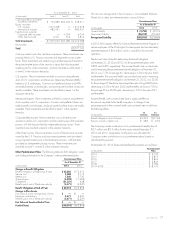
The amounts recognized in the Company’s Consolidated Balance
Sheets for its other postretirement plans are as follows:
Postretirement Plans
As of December 31
(in thousands) 2013 2012
Current liability ..................... $ (3,795) $ (3,919)
Noncurrent liability ................... (36,219) (59,949)
Recognized Liability ................ $(40,014) $(63,868)
In 2012, the Company offered a Voluntary Retirement Incentive Program to
certain employees of The Washington Post newspaper and recorded early
retirement expense of $0.4 million, which is included in discontinued
operations.
The discount rates utilized for determining the benefit obligation
at December 31, 2013 and 2012, for the postretirement plans were
3.80% and 3.30%, respectively. The assumed health care cost trend rate
used in measuring the postretirement benefit obligation at December 31,
2013, was 7.75% for pre-age 65, decreasing to 5.0% in the year 2025
and thereafter. The assumed health care cost trend rate used in measuring
the postretirement benefit obligation at December 31, 2013, was 23.4%
for the post-age 65 Medicare Advantage Prescription Drug (MA-PD) plan,
decreasing to 5.0% in the year 2023 and thereafter, and was 6.75% for
the post-age 65 non MA-PD plan, decreasing to 5.0% in the year 2021
and thereafter.
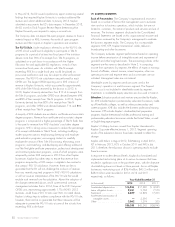
Assumed health care cost trend rates have a significant effect on
the amounts reported for the health care plans. A change of one
percentage point in the assumed health care cost trend rates would have
the following effects:
(in thousands) 1%
Increase 1%
Decrease
Benefit obligation at end of year ........... $2,322 $(2,123)
Service cost plus interest cost .............. $ 284 $ (252)
The Company made contributions to its postretirement benefit plans of
$3.7 million and $3.3 million for the years ended December 31,
2013 and 2012, respectively. As the plans are unfunded, the
Company makes contributions to its postretirement plans based on
actual benefit payments.
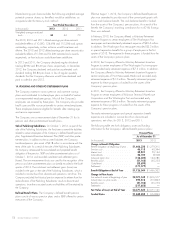
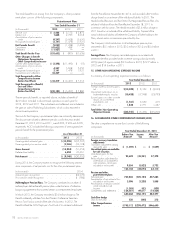
At December 31, 2013, future estimated benefit payments are as follows:
(in thousands) Postretirement
Plans
2014 .................................... $ 3,795
2015 .................................... $ 3,819
2016 .................................... $ 3,866
2017 .................................... $ 3,846
2018 .................................... $ 3,784
2019–2023 ............................... $18,195
2013 FORM 10-K 77