Washington Post 2013 Annual Report Download - page 85
Download and view the complete annual report
Please find page 85 of the 2013 Washington Post annual report below. You can navigate through the pages in the report by either clicking on the pages listed below, or by using the keyword search tool below to find specific information within the annual report.-
 1
1 -
2
-
3
-
4
-
5
-
6
-
7
-
8
-
9
-
10
-
11
-
12
-
13
-
14
-
15
-
16
-
17
-
18
-
19
-
20
-
21
-
22
-
23
-
24
-
25
-
26
-
27
-
28
-
29
-
30
-
31
-
32
-
33
-
34
-
35
-
36
-
37
-
38
-
39
-
40
-
41
-
42
-
43
-
44
-
45
-
46
-
47
-
48
-
49
-
50
-
51
-
52
-
53
-
54
-
55
-
56
-
57
-
58
-
59
-
60
-
61
-
62
-
63
-
64
-
65
-
66
-
67
-
68
-
69
-
70
-
71
-
72
-
73
-
74
-
 75
75 -
 76
76 -
 77
77 -
 78
78 -
 79
79 -
 80
80 -
 81
81 -
 82
82 -
 83
83 -
 84
84 -
 85
85 -
 86
86 -
 87
87 -
 88
88 -
 89
89 -
 90
90 -
 91
91 -
 92
92 -
 93
93 -
 94
94 -
 95
95 -
96
-
97
-
98
-
99
-
100
-
101
-
102
-
103
-
104
-
105
-
106
-
107
-
108
-
109
-
110
-
111
-
112
 |
 |

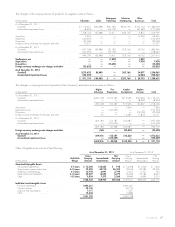
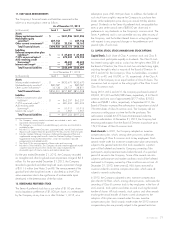
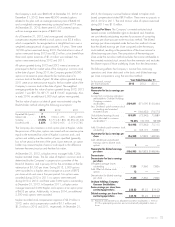
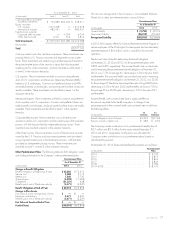
The changes in the carrying amount of goodwill, by segment, were as follows:
(in thousands) Education Cable
Newspaper
Publishing
Television
Broadcasting
Other
Businesses Total
As of December 31, 2011
Goodwill ........................................... $1,116,615 $85,488 $ 81,183 $203,165 $100,152 $1,586,603
Accumulated impairment losses ........................... (8,492) —(65,772) —(97,342) (171,606)
1,108,123 85,488 15,411 203,165 2,810 1,414,997
Acquisitions ........................................... 7,364 —— —16,242 23,606
Impairment ............................................ (102,259) —— — —(102,259)
Dispositions ........................................... (29,000) —— — —(29,000)
Foreign currency exchange rate changes and other .............. 10,571 —— — —10,571
As of December 31, 2012
Goodwill ........................................... 1,097,058 85,488 81,183 203,165 19,052 1,485,946
Accumulated impairment losses ........................... (102,259) —(65,772) ——(168,031)
994,799 85,488 15,411 203,165 19,052 1,317,915
Reallocation, net .................................... — — (1,809) — 1,809 —
Acquisitions ........................................ — — — — 7,934 7,934
Dispositions ........................................ — — (13,602) — — (13,602)
Foreign currency exchange rate changes and other .......... (23,625) — — — — (23,625)
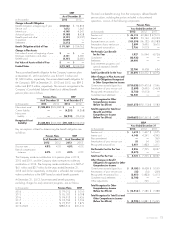
As of December 31, 2013
Goodwill ........................................ 1,073,433 85,488 — 203,165 34,877 1,396,963
Accumulated impairment losses ....................... (102,259) — — — (6,082) (108,341)
$ 971,174 $85,488 $ — $203,165 $ 28,795 $1,288,622
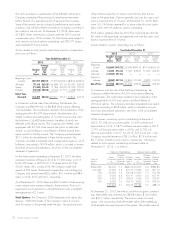
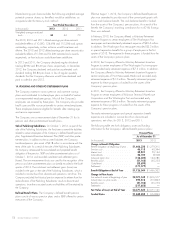
The changes in carrying amount of goodwill at the Company’s education division were as follows:
(in thousands)
Higher
Education
Test
Preparation
Kaplan
International
Kaplan
Ventures Total
As of December 31, 2011
Goodwill ........................................................ $409,128 $ 152,187 $515,936 $ 39,364 $1,116,615
Accumulated impairment losses ........................................ —— —(8,492) (8,492)
409,128 152,187 515,936 30,872 1,108,123
Acquisitions ........................................................ ——7,364 —7,364
Impairment Losses ................................................... —(102,259) ——(102,259)
Dispositions ........................................................ —— —(29,000) (29,000)
Foreign currency exchange rate changes and other ........................... 56 —12,387 (1,872) 10,571
As of December 31, 2012
Goodwill ........................................................ 409,184 152,187 535,687 —1,097,058
Accumulated impairment losses ........................................ —(102,259) ——(102,259)
409,184 49,928 535,687 —994,799
Foreign currency exchange rate changes and other ...................... (168) — (23,457) — (23,625)
As of December 31, 2013
Goodwill ....................................................... 409,016 152,187 512,230 — 1,073,433
Accumulated impairment losses ...................................... — (102,259) — — (102,259)
$409,016 $ 49,928 $512,230 $ — $ 971,174
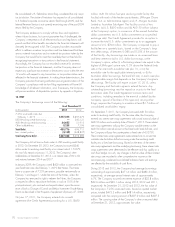
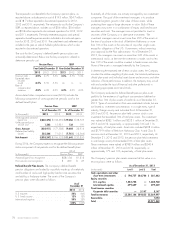
Other intangible assets consist of the following:
Useful Life
Range
As of December 31, 2013 As of December 31, 2012
(in thousands)
Gross
Carrying
Amount Accumulated
Amortization
Net
Carrying
Amount
Gross
Carrying
Amount
Accumulated
Amortization
Net
Carrying
Amount
Amortized Intangible Assets
Noncompete agreements ....................... 2–5 years $ 13,540 $12,622 $ 918 $ 14,008 $12,546 $ 1,462
Student and customer relationships ................ 2–10 years 72,050 45,718 26,332 73,693 40,787 32,906
Databases and technology ...................... 3–5 years 10,790 6,991 3,799 6,457 5,707 750
Trade names and trademarks .................... 2–10 years 22,327 16,052 6,275 26,634 18,185 8,449
Other ..................................... 1–25 years 9,836 7,572 2,264 8,849 6,839 2,010
$128,543 $88,955 $39,588 $129,641 $84,064 $45,577
Indefinite-Lived Intangible Assets
Franchise agreements .......................... $496,321 $496,321
Wireless licenses ............................. 22,150 22,150
Licensure and accreditation ...................... 7,171 7,371
Other ..................................... 15,636 13,886
$541,278 $539,728
2013 FORM 10-K 67