Washington Post 2013 Annual Report Download - page 53
Download and view the complete annual report
Please find page 53 of the 2013 Washington Post annual report below. You can navigate through the pages in the report by either clicking on the pages listed below, or by using the keyword search tool below to find specific information within the annual report.-
 1
1 -
2
-
3
-
4
-
5
-
6
-
7
-
8
-
9
-
10
-
11
-
12
-
13
-
14
-
15
-
16
-
17
-
18
-
19
-
20
-
21
-
22
-
23
-
24
-
25
-
26
-
27
-
28
-
29
-
30
-
31
-
32
-
33
-
34
-
35
-
36
-
37
-
38
-
39
-
40
-
41
-
42
-
 43
43 -
 44
44 -
 45
45 -
 46
46 -
 47
47 -
 48
48 -
 49
49 -
 50
50 -
 51
51 -
 52
52 -
 53
53 -
 54
54 -
 55
55 -
 56
56 -
 57
57 -
 58
58 -
 59
59 -
 60
60 -
 61
61 -
 62
62 -
 63
63 -
64
-
65
-
66
-
67
-
68
-
69
-
70
-
71
-
72
-
73
-
74
-
75
-
76
-
77
-
78
-
79
-
80
-
81
-
82
-
83
-
84
-
85
-
86
-
87
-
88
-
89
-
90
-
91
-
92
-
93
-
94
-
95
-
96
-
97
-
98
-
99
-
100
-
101
-
102
-
103
-
104
-
105
-
106
-
107
-
108
-
109
-
110
-
111
-
112
 |
 |
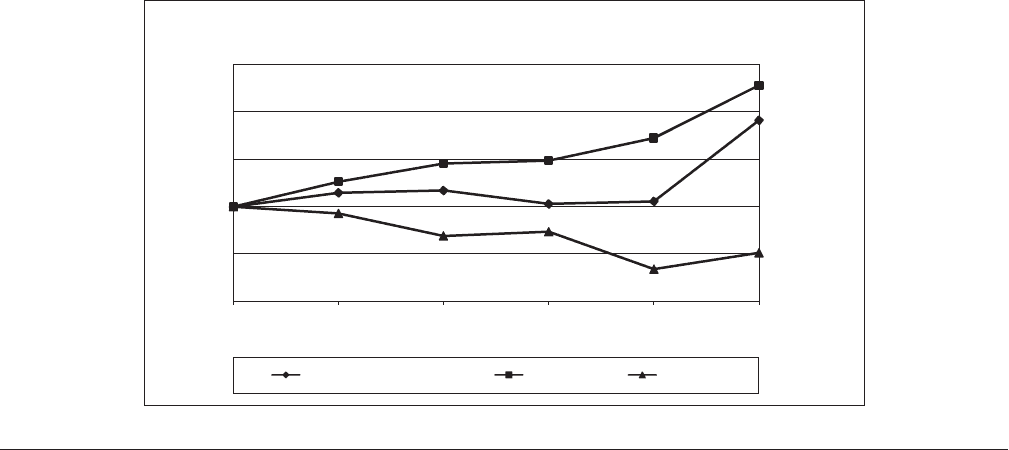
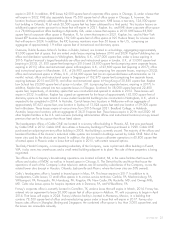
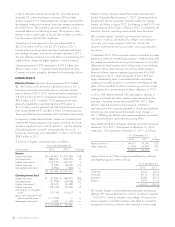
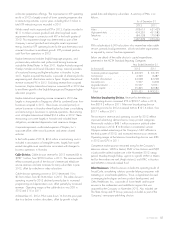
Performance Graph
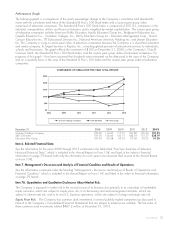
The following graph is a comparison of the yearly percentage change in the Company’s cumulative total shareholder
return with the cumulative total return of the Standard & Poor’s 500 Stock Index and a custom peer group index
comprised of education companies. The Standard & Poor’s 500 Stock Index is comprised of 500 U.S. companies in the
industrial, transportation, utilities and financial industries and is weighted by market capitalization. The custom peer group
of education companies includes American Public Education, Apollo Education Group Inc., Bridgepoint Education Inc.,
Capella Education Co., Corinthian Colleges, Inc., DeVry Education Group Inc., Education Management Corp., Grand
Canyon Education Inc., ITT Educational Services Inc., National American University Holdings Inc. and Strayer Education
Inc. The Company is using a custom peer index of education companies because the Company is a diversified education
and media company. Its largest business is Kaplan, Inc., a leading global provider of educational services to individuals,
schools and businesses. The graph reflects the investment of $100 on December 31, 2008, in the Company’s Class B
Common Stock, the Standard & Poor’s 500 Stock Index, and the custom peer group index of education companies. For
purposes of this graph, it has been assumed that dividends were reinvested on the date paid in the case of the Company
and on a quarterly basis in the case of the Standard & Poor’s 500 Index and the custom peer group index of education
companies.
$50
$100
$150
$250
$200
$0
COMPARISON OF CUMULATIVE FIVE YEAR TOTAL RETURN
Graham Holdings Company S&P 500 Index Peer Group
2008 2009 2010 2011 2012 2013
December 31 2008 2009 2010 2011 2012 2013
Graham Holdings Company ................................. 100.00 114.46 117.31 102.98 105.34 191.32
S&P 500 Index ........................................... 100.00 126.46 145.51 148.59 172.37 228.19
Education Peer Group ...................................... 100.00 92.68 69.25 73.68 34.23 51.28
Item 6. Selected Financial Data.
See the information for the years 2009 through 2013 contained in the table titled “Five-Year Summary of Selected
Historical Financial Data,” which is included in this Annual Report on Form 10-K and listed in the index to financial
information on page 39 hereof (with only the information for such years to be deemed filed as part of this Annual Report
on Form 10-K).
Item 7. Management’s Discussion and Analysis of Financial Condition and Results of Operations.
See the information contained under the heading “Management’s Discussion and Analysis of Results of Operations and
Financial Condition,” which is included in this Annual Report on Form 10-K and listed in the index to financial information
on page 39 hereof.
Item 7A. Quantitative and Qualitative Disclosures About Market Risk.
The Company is exposed to market risk in the normal course of its business due primarily to its ownership of marketable
equity securities, which are subject to equity price risk; to its borrowing and cash-management activities, which are
subject to interest rate risk; and to its non-U.S. business operations, which are subject to foreign exchange rate risk.
Equity Price Risk. The Company has common stock investments in several publicly traded companies (as discussed in
Note 4 to the Company’s Consolidated Financial Statements) that are subject to market price volatility. The fair value of
these common stock investments totaled $487.2 million at December 31, 2013.
2013 FORM 10-K 35