Washington Post 2013 Annual Report Download - page 76
Download and view the complete annual report
Please find page 76 of the 2013 Washington Post annual report below. You can navigate through the pages in the report by either clicking on the pages listed below, or by using the keyword search tool below to find specific information within the annual report.-
 1
1 -
2
-
3
-
4
-
5
-
6
-
7
-
8
-
9
-
10
-
11
-
12
-
13
-
14
-
15
-
16
-
17
-
18
-
19
-
20
-
21
-
22
-
23
-
24
-
25
-
26
-
27
-
28
-
29
-
30
-
31
-
32
-
33
-
34
-
35
-
36
-
37
-
38
-
39
-
40
-
41
-
42
-
43
-
44
-
45
-
46
-
47
-
48
-
49
-
50
-
51
-
52
-
53
-
54
-
55
-
56
-
57
-
58
-
59
-
60
-
61
-
62
-
63
-
64
-
65
-
 66
66 -
 67
67 -
 68
68 -
 69
69 -
 70
70 -
 71
71 -
 72
72 -
 73
73 -
 74
74 -
 75
75 -
 76
76 -
 77
77 -
 78
78 -
 79
79 -
 80
80 -
 81
81 -
 82
82 -
 83
83 -
 84
84 -
 85
85 -
 86
86 -
87
-
88
-
89
-
90
-
91
-
92
-
93
-
94
-
95
-
96
-
97
-
98
-
99
-
100
-
101
-
102
-
103
-
104
-
105
-
106
-
107
-
108
-
109
-
110
-
111
-
112
 |
 |

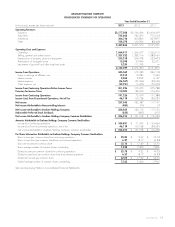
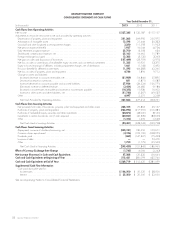
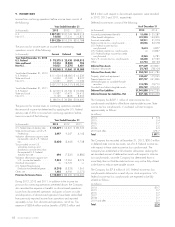
GRAHAM HOLDINGS COMPANY
CONSOLIDATED STATEMENTS OF CASH FLOWS
Year Ended December 31,
(in thousands) 2013 2012 2011
Cash Flows from Operating Activities
Net Income ..................................................................... $ 237,345 $ 132,187 $ 117,157
Adjustments to reconcile net income to net cash provided by operating activities:
Depreciation of property, plant and equipment .......................................... 251,262 269,992 255,975
Amortization of intangible assets .................................................... 13,598 21,444 30,333
Goodwill and other long-lived asset impairment charges ................................... 3,250 111,593 11,923
Net pension expense (benefit) ...................................................... 1,927 16,044 (4,726)
Early retirement program expense ................................................... 22,700 8,508 634
Stock-based compensation expense, net .............................................. 25,163 14,662 11,789
Foreign exchange loss (gain) ....................................................... 13,382 (3,132) 3,263
Net gain on sales and disposition of businesses ......................................... (157,449) (23,759) (2,975)
Net loss on sales or write-downs of marketable equity securities and cost method investments ........ 11,325 10,925 53,375
Equity in losses (earnings) of affiliates, including impairment charges, net of distributions ............ 1,661 (1,148) 5,492
Provision (benefit) for deferred income taxes ............................................ 11,595 (64,383) 42,265
Net loss on sales of property, plant and equipment ...................................... 4,746 1,896 9,712
Change in assets and liabilities:
(Increase) decrease in accounts receivable, net ........................................ (81,989) (14,846) 27,895
Decrease (increase) in inventories .................................................. 851 (1,871) (1,587)
Increase (decrease) in accounts payable and accrued liabilities ............................ 37,926 (34,224) (126,771)
(Decrease) increase in deferred revenue ............................................. (3,434) 24,482 (9,186)
(Increase) in income taxes receivable and increase in income taxes payable .................. (18,352) 11,936 16,002
Increase in other assets and other liabilities, net ....................................... (51,740) (5,367) (49,537)
Other ........................................................................ 4,097 2,275 2,258
Net Cash Provided by Operating Activities ........................................... 327,864 477,214 393,291
Cash Flows from Investing Activities
Net proceeds from sales of businesses, property, plant and equipment and other assets ............ 248,105 76,863 49,157
Purchases of property, plant and equipment ............................................ (224,093) (217,995) (216,381)
Purchases of marketable equity securities and other investments .............................. (28,073) (48,031) (8,165)
Investments in certain businesses, net of cash acquired .................................... (20,027) (40,339) (83,699)
Other ........................................................................ (1,313) 1,459 (1,640)
Net Cash Used in Investing Activities ............................................... (25,401) (228,043) (260,728)
Cash Flows from Financing Activities
(Repayment) issuance of short-term borrowing, net ........................................ (240,121) 130,450 109,671
Common shares repurchased ...................................................... (4,196) (103,196) (248,055)
Dividends paid ................................................................. (863) (147,327) (75,493)
Issuance of debt ................................................................ ——52,476
Other ........................................................................ 1,750 (1,772) (25,560)
Net Cash Used in Financing Activities .............................................. (243,430) (121,845) (186,961)
Effect of Currency Exchange Rate Change ........................................... (1,745) 4,006 (2,243)
Net Increase (Decrease) in Cash and Cash Equivalents .................................. 57,288 131,332 (56,641)
Cash and Cash Equivalents at Beginning of Year ...................................... 512,431 381,099 437,740
Cash and Cash Equivalents at End of Year ........................................... $ 569,719 $ 512,431 $ 381,099
Supplemental Cash Flow Information
Cash paid during the year for:
Income taxes ................................................................ $ 144,500 $ 50,531 $ 38,500
Interest ..................................................................... $ 35,500 $ 35,500 $ 32,650
See accompanying Notes to Consolidated Financial Statements.
58 GRAHAM HOLDINGS COMPANY